Counting artists and cultural workers in Canada
Thoughts on the possibilities and weaknesses of official data sources
Last week, I analyzed Canada-wide data on the median and average wages of employed workers in the arts and culture, using the Labour Force Survey (LFS). I had planned to present provincial comparisons from the same dataset today, but I’m delaying that by a week and devoting this post to my thoughts about the possibilities and limitations of the LFS and census. Feel free to provide your thoughts and comments!
In Canada, two key sources of information about the labour force are: 1) the monthly Labour Force Survey, which provides widely reported data on employment and unemployment in the country; and 2) the quinquennial census, which has an extremely large sample size that allows us to examine significant details about specific types of workers, including artists and cultural workers.
ICYMI: Here are links to some of my previous posts using the census and the Labour Force Survey.
Census analysis to date
Since the end of December, I have written five posts about artists, based on readily available information from the 2021 census:
In June, I plan to start writing about the broader category of workers in cultural occupations (including artists).
I am still waiting on custom data on artists and cultural workers from the 2021 census. Once available, this will provide fine-grained national, provincial, regional, and local information – including many more breakdowns than province and gender. But I’ll only be able to publish an analysis for jurisdictions with a sponsor-level subscriber.
Interested in a demographic and financial profile of artists in your province, region, or municipality? Subscribe now at the sponsor / shareable level (just $750) to get a custom post with many important breakdowns (occupation, gender, education, age, racialized individuals, Indigenous Peoples). Bonus: you’ll receive access to every other subscribers-only post for the next 12 months.
Labour Force Survey analysis to date
Multiple job holding in Canada and in each province (Are arts and culture workers in smaller or larger provinces more likely to hold multiple jobs?)
Hours worked (as opposed to just counting the number of workers)
Local arts and culture workers (3 posts on Census Metropolitan Areas: the six largest, six medium sized, and seven smaller CMAs)
No official source has as many details as we would like about artists and cultural workers. Here are some of the shortcomings …
Limitations of the Labour Force Survey and census on artists and cultural workers
While the Labour Force Survey (LFS) and the census are the best available official sources regarding artists and cultural workers, they are far from perfect.
The LFS, even using annual averages, doesn’t have a large enough sample size to delve into occupation-by-occupation details about artists and cultural workers. It does provide solid (and readily available) information about three summary groupings: “professional occupations in the arts and culture”; “technical occupations in the arts and culture”; and (other) “occupations in the arts, culture, and sports” (in most provinces). More information about the three summary groupings is available below.
The sample size of the LFS also doesn’t allow for detailed demographic analysis of artists and cultural workers. I’ve only relied on the LFS for simple breakdowns (such as women and men -- other gender identities are not yet captured there). I won’t delve into demographic details today, as this post is already quite long.
The quinquennial census provides more granular information on artists and cultural workers, thanks to its sample of 25% of the Canadian population for the long form questionnaire (which contains the questions on work activities). However, the census does not ask about many topics of interest in the arts community, such as secondary jobs or hours worked. In the current census cycle (2021), the income information relates to the 2020 calendar year, which was the toughest year for pandemic shutdowns. Artists’ incomes in 2020 were far from typical, as has been shown in many custom surveys (e.g., I Lost My Gig Canada, National Arts and Culture Impact Survey, Artists and Content Creators Economic Survey, Indigenous arts workers, reliance on the Canada Emergency Response Benefit).
Limitations of the occupational categories themselves
Some occupations are structurally excluded from arts and culture occupations – by which I mean excluded from Statistics Canada’s standard occupation categories related to artists and cultural workers. In other words, these exclusions are not due to the limitations of any particular dataset but are due to the lack of fine-grained information in standard occupation categories.
Arts and culture workers who are grouped into other, non-culture-specific occupation groups include:
People who teach in elementary, secondary, and post-secondary institutions. The arts and culture occupation groups exclude, for example, visual artists who teach at the post-secondary level (who happen to be some of the highest paid visual artists). Note that people who teach independently or in private studios are included in arts and culture occupations.
Government employees with a cultural portfolio at any level of government. Government workers are not separated based on their portfolios.
Directors and other senior managers in the arts and culture, including cultural associations. As is the case for government workers, directors and senior managers are not separated based on the nature of their work or association.
Data on an occupation-by-occupation basis, typically from the census, are not as detailed as we might like. For example, census data on dancers will include many different types of dancers, such as ballet, hip hop, traditional, contemporary, and owner-operators of dance studios. No breakdowns by dance style are available from official statistics.
However, it is possible to crosscut census occupation statistics with industry statistics, which could provide information about, for example, “dancers in education” or “dancers in the performing arts”.
Only custom surveys in the sector can get at some of the finer details of artists’ working lives. Sticking with the dance example, I did a custom survey with the Dancer Transition Resource Centre in 2016 that captured specifics about the working lives of dance performers.
Occupation groups available in the Labour Force Survey annual averages
By my estimate, using the granular data available in the 2021 census, 95% of the employed workers in three summary groupings in the LFS work in the arts and culture, while the other 5% work in sports (all of whom are in the third grouping). The three summary groupings are:
Professional occupations in the arts and culture, including some artists, such as producers, directors, conductors, musicians, and writers; translators and other communications professionals; as well as librarians, archivists, conservators, and curators.
Technical occupations in the arts and culture, including graphic and interior designers, plus technical workers in libraries, archives, motion pictures, broadcasting, and the performing arts. (Note that StatsCan includes the word “sport” in its title for this grouping, but that appears to be a legacy issue. There are no sports occupations in this summary grouping.)
(Other) occupations in the arts, culture, and sports, including artists such as dancers, actors, comedians, circus performers, photographers, craftspeople, and visual artists; theatre and fashion designers; select museum and art gallery jobs (e.g., registrars, restorers); assistants in film, broadcasting, photography, and performing arts; as well as a few sports occupations (athletes, coaches, and referees). Unlike the other two summary groupings, this one includes some sports workers, in addition to arts and culture workers.
A fourth summary grouping (“support occupations in art, culture and sport”) actually contains very few arts and culture workers -- roughly 5,000 of them, or about 4% of all workers in the summary grouping. I have therefore not included this summary grouping in my analyses.
Arts and culture workers excluded
The Labour Force Survey dataset excludes what Statistics Canada considers “middle management positions” in the arts and culture, such as managers in libraries, archives, museums, art galleries, performing arts, publishing, motion pictures, and broadcasting. The dataset classifies these managers into a summary grouping of management positions (“specialized middle management occupations”) that contain many more workers outside than inside the arts and culture.
Earnings data from the Labour Force Survey exclude self-employed workers. Because artists have very high self-employment rates, many of them are therefore excluded from the earnings data, along with other self-employed cultural workers. However, those self-employed artists and cultural workers who have an employed position in their main job are included.
Statistics Canada’s three summary occupation groupings account for about two-thirds of all arts and culture employees, based on the information available through Statistics Canada’s standard occupation groups.
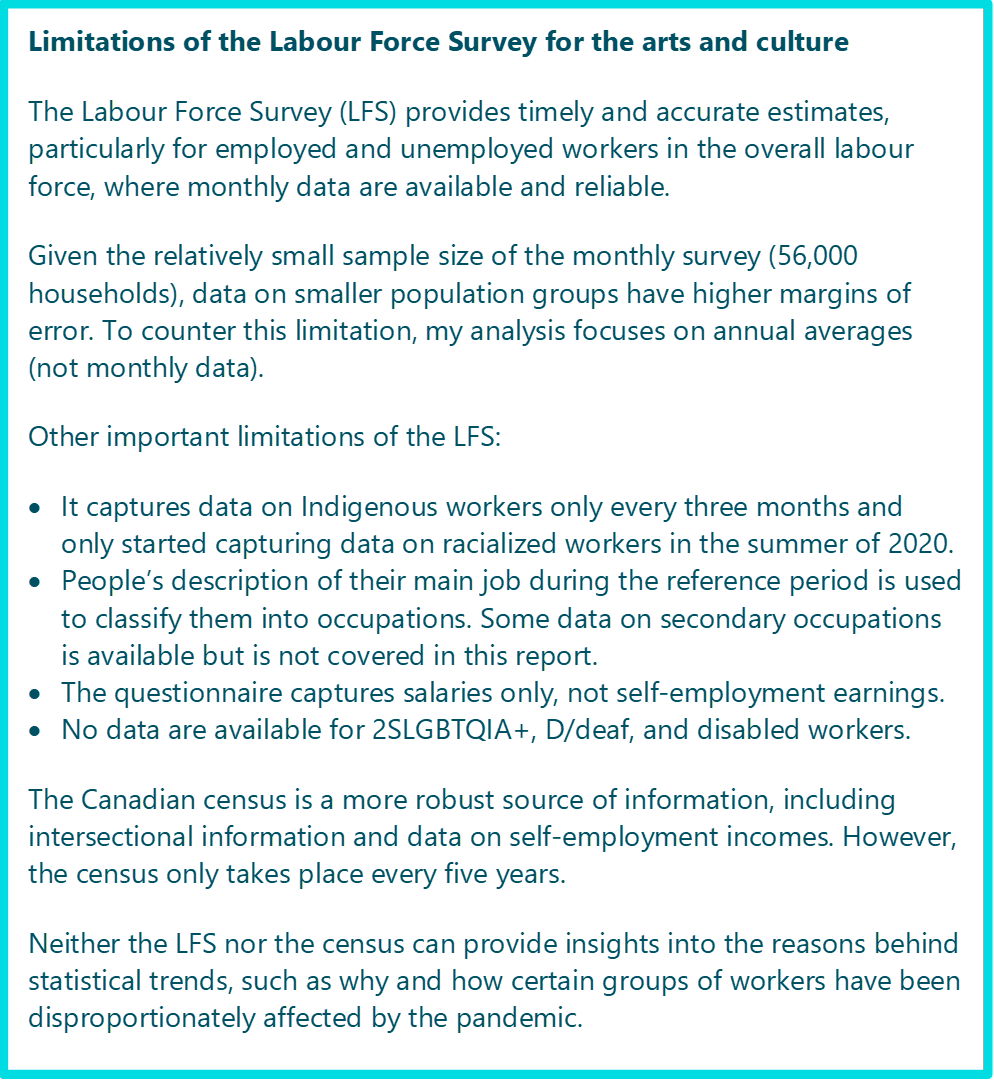
I have summarized some other limitations of the Labour Force Survey in the following box.
Other sources of official statistics on artists and cultural workers in Canada
Finally, there are two other official surveys of some interest, but they are not as useful for occupational data:
The Survey of Employment, Payrolls and Hours, which summarizes information from payroll form submissions of businesses and organizations, providing information on the number of employees and their average weekly earnings by industry (not by occupation). So, in the world of arts and culture, the dataset provides information on employees in the arts, entertainment, and recreation, in performing arts companies, in heritage organizations, and in various cultural industries. But it does not provide information on performing artists, visual artists, curators, dancers, technicians, etc.
The Job Vacancy and Wage Survey, which provides information on vacant positions and the wages being offered. I have analyzed this dataset a number of times over the past year (most recent post here).
Thanks for reading through this detailed post on methods! Any thoughts or comments?


