In 2022, job vacancies in the performing arts and heritage reached their highest levels since 2015
The moderate job vacancy rate in the broad arts, heritage, and entertainment sector in the fourth quarter of 2022 was still high by longer-term standards
As I noted last week, recruiting and retaining staff is the second most commonly cited obstacle for organizations and businesses in the arts, heritage, and entertainment (next to inflation). 42% of organizations and businesses indicated that staff recruitment and retention is an important challenge.
Today’s post examines job vacancies in 2022. Part of the analysis is based on annual averages, while the rest of the post examines fourth quarter data (updating the analyses I did for the third quarter, second quarter, and first quarter of 2022).
My analysis of the annual averages for job vacancies delves into arts and heritage subsectors between 2015 and 2022. The job vacancy rates in the performing arts + spectator sports, and in heritage institutions were the highest rates recorded since the start of this dataset in 2015. There was also a record number of job vacancies (not just the %) in the performing arts, spectator sports, and heritage institutions in 2022.
My analysis of fourth quarter data (i.e., October through December), released by Statistics Canada on March 21, shows that the job vacancy rate has stabilized at a moderately high level in the arts, heritage, and entertainment. Similarities and differences across the country are also pointed out.
Statistics Canada publishes job vacancy data for payroll employees only. Arts, heritage, and entertainment (which Statistics Canada refers to as “arts, entertainment, and recreation”) includes performing arts, spectator sports, and related industries (code 711), heritage institutions (code 712), as well as amusement, gambling, and recreation industries (code 713). This post includes quarterly data on the broad StatsCan sector grouping and annual data on the more detailed subsectors.
Annual averages of job vacancy rates were very high in 2022
The data update for the fourth quarter provides an opportunity to look at annual averages, along with changes back to 2015 (the start of comparable data). The annual averages provide a higher degree of reliability, which allows for more detailed analysis than the quarterly data. This section of the post examines the job vacancy rates for the performing arts and spectator sports (a combined subsector in StatsCan data) and heritage institutions, in addition to the overall rate in the arts, heritage, and entertainment.
The first graph below shows the annual average for the arts, heritage, and entertainment between 2015 and 2022. The job vacancy rate increased substantially in 2021 and remained high in 2022.
A similar pattern emerges for the two arts and heritage subsectors available in the dataset.
The annual averages for heritage institutions and for the performing arts and spectator sports increased substantially in 2021 and remained high in 2022. The two subsectors follow very similar patterns to each other in the following graph.
High number of vacant positions
In 2022, job vacancies in the performing arts and heritage reached their highest levels since the inception of this dataset in 2015.
In the performing arts and spectator sports, the number of job vacancies reached 3,700 in 2022, well above the levels in 2021 (2,200) and 2015 (just 1,600). In other words, the number of job vacancies has more than doubled since 2015. There was an average of 52,300 payroll employees in the performing arts and spectator sports in 2022.
For heritage institutions, the number of job vacancies reached 1,700 in 2022, also well above the levels in 2021 (1,200) and 2015 (just 760). As was the case in the performing arts, the number of job vacancies in heritage institutions has more than doubled since 2015. There was an average of 25,200 payroll employees in heritage institutions in 2022.
The combined number of payroll employees in the performing arts, spectator sports, and heritage institutions was 77,500 in 2022, while the number of job vacancies was 5,400.
Quarterly data: The overall job vacancy rate in the arts, heritage, and entertainment remained at a moderate level in the fourth quarter of 2022
After a significant decrease in the third quarter, the job vacancy rate stabilized at a moderate level (5.0%) in the fourth quarter of 2022. This rate is relatively high by pre-pandemic standards, but it is one of the lowest rates since early 2021.
The following graph shows the changes over time, not seasonally adjusted. (Data on job vacancies were not collected in the second and third quarters of 2020, where there is a gap in the graph.)
In the fourth quarter of 2022, there were 15,900 job vacancies and 300,700 payroll employees in the broader arts, heritage, and entertainment sector.
Moderate job vacancy rates in the fourth quarter across the country
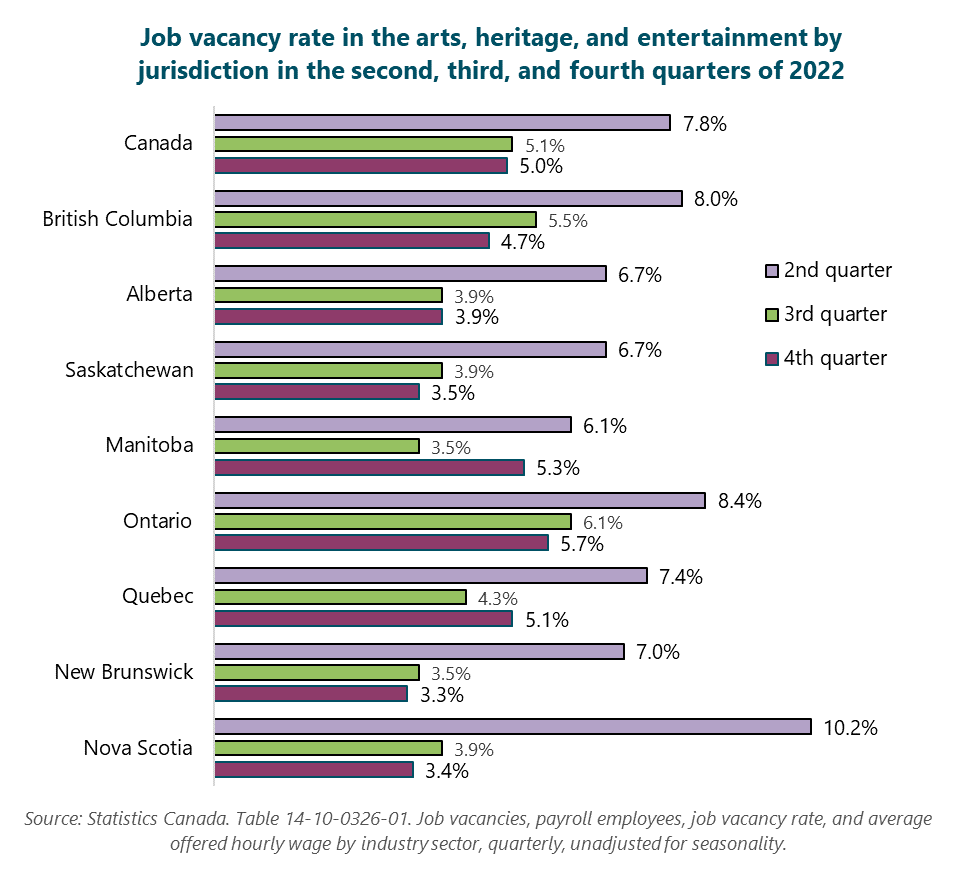
In all provinces with reliable data, the job vacancy rate in the arts, heritage, and entertainment decreased substantially between in the third quarter of 2022 and remained at a moderate level in the fourth quarter, as shown in the following graph.
Note and link to the data source on job vacancies
The data in this post are not adjusted for “normal” seasonal fluctuations. Statistics Canada does publish seasonally adjusted data for Canada (but not for the provinces). I have chosen to focus on the unadjusted data, which reflect “real” conditions in the sector at a given point in time. The unadjusted counts of job vacancies and positions (and therefore the job vacancy rate) are the actual numbers during the period. Whether changes are typical for a certain time of year is of secondary interest, in my view.
Statistics Canada. Table 14-10-0326-01. Job vacancies, payroll employees, job vacancy rate, and average offered hourly wage by industry sector, quarterly, unadjusted for seasonality, https://www150.statcan.gc.ca/t1/tbl1/en/tv.action?pid=1410032601.


