
Canada's trade with the USA in the arts, culture, and heritage
Analysis of most recent data and changes since 2010

Canada has had a cultural trade deficit with the United States in every year since 2010. Today’s article digs into statistics on Canada’s trade in the arts, culture, and heritage with our closest neighbour, including an analysis of trade levels in 2023 as well as changes since 2010.
Recognizing that 2023 data are not particularly current in the present trade environment, I looked into quarterly datasets on international trade. However, as often happens, the categories that are published quarterly (e.g., “personal, cultural, and recreational services”) are very broad and not particularly informative about the situation of the arts, culture, and heritage. I am therefore sticking to an analysis of the 2023 dataset, which was released in October of 2025.
The statistics for the overall cultural sector (which I also call “culture” or “the arts, culture, and heritage”) include all nine domains captured in Statistics Canada’s economic data: live performance + visual & applied arts + written & published works + sound recording + audiovisual & interactive media + heritage & libraries + governance, funding & professional support + education & training + multi domain.
I have combined selected cultural domains and subdomains into an imperfect but reasonable approximation of “the arts”, one that includes live performances, visual arts (including crafts and photography), books, film and video, and sound recording.
Trade surpluses and deficits are calculated as cultural exports minus cultural imports. I have adjusted historical data for inflation.
This is the fourth and final article in a series examining Statistics Canada’s dataset on exports and imports of the arts, culture, and heritage. Previous articles contained analyses of the most recent data for Canada and the provinces, as well as trends in cultural trade (with all countries) between 2010 and 2023.
The USA is Canada’s main cultural trading partner
As I noted a few weeks ago, in 2023, the United States accounts for roughly two-thirds of all cultural exports ($18.1 billion, or 67%) and imports ($22.2 billion, or 62%). Canada had a $4.2 billion trade deficit with the USA in 2023.
The United States accounts for about three-quarters of all arts exports from Canada ($12.5 billion, or 78% of the worldwide total) and two-thirds of all arts imports ($9.4 billion, or 66%). In 2023, Canada had a $3.1 billion arts trade surplus with the USA.
The value of trade with the USA and the American share of Canada’s worldwide trade vary between the four arts goods and services that have the highest levels of international trade:
Crafts: exports of $6.7 billion to the USA (92% of all crafts exports), imports of $4.1 billion from the US (65% of all crafts imports), surplus of $2.7 billion (after rounding)
Film and video: exports of $3.8 billion (67% of all film and video exports), imports of $1.1 billion (64% of all film and video imports), surplus of $2.7 billion
Books: exports of $0.8 billion (88% of all books exports), imports of $2.4 billion (78% of all books imports), deficit of $1.6 billion
Live performances: exports of $0.6 billion (56% of all live performance exports), imports of $0.9 billion (55% of all live performance imports), deficit of $0.3 billion
Trends since 2010
The cultural trade deficit with the USA has decreased slightly since 2010
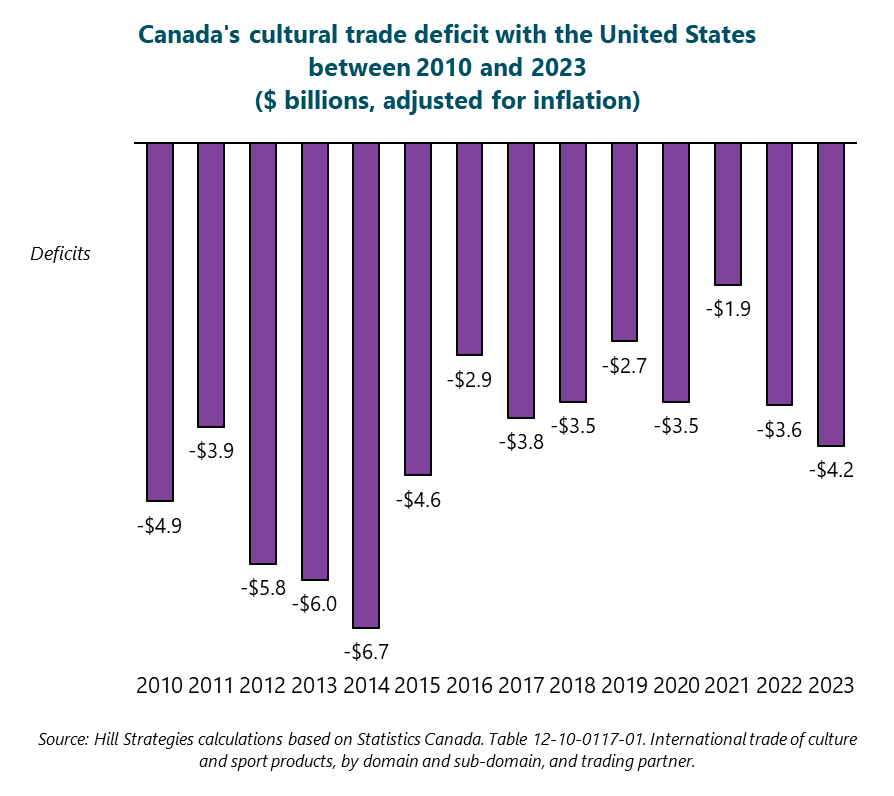
Canada has had a cultural trade deficit with the United States in every year since 2010, but the deficit has decreased somewhat over time. As shown in today’s first graph, the cultural trade deficit with the USA was highest between 2012 and 2014 and lowest in 2021. The deficit in 2023 ($4.2 billion) was 15% lower than the deficit in 2010 ($4.9 billion). The statistics in the graph have been adjusted for inflation.
The arts trade surplus with the USA used to be a deficit
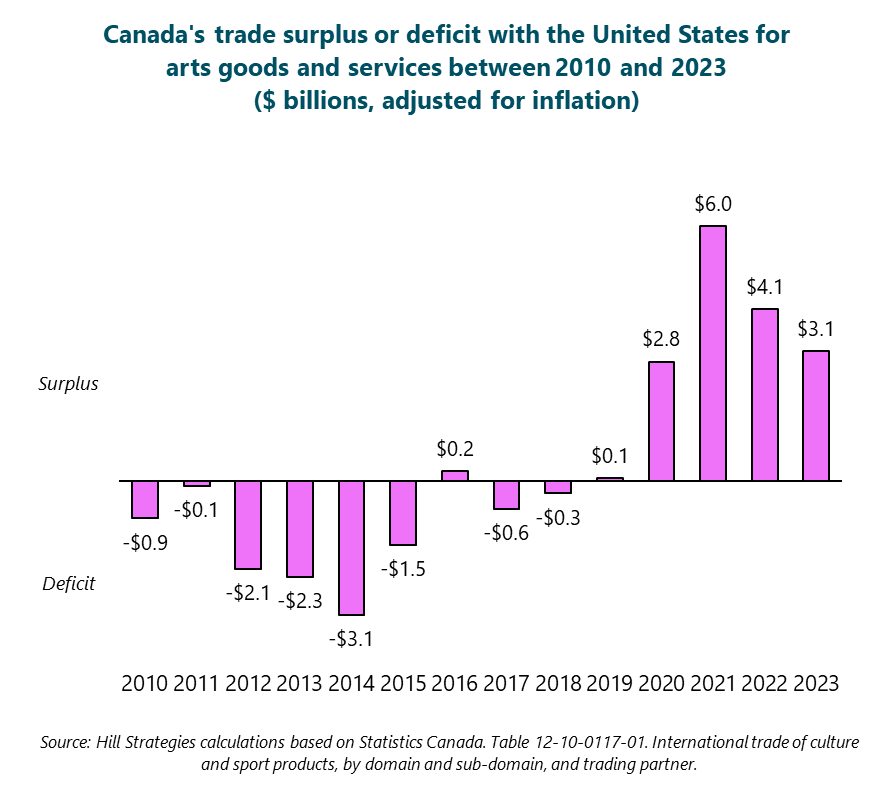
In 2023, for arts products, there was a trade surplus with the USA of $3.1 billion. The following graph shows that Canada had an arts trade deficit with the USA in eight years between 2010 and 2023 and a surplus in six years, including the five most recent years (i.e., 2019 through 2023).
Data sources and notes
Source: Statistics Canada. Table 12-10-0117-01. International trade of culture and sport products, by domain and sub-domain, and trading partner, 2023.
Note: Statistics Canada also publishes data on interprovincial trade in cultural goods and services, but the most recent data are only from 2021. Because the data are quite old, I’m not analyzing them.
The international trade dataset is based on multiple sources, including surveys and administrative filings by cultural businesses, organizations, and individuals. As just one example, here is the main export-related question from the performing arts survey:
During the reporting period [of x to y], did this business receive revenue from clients outside Canada for the sale of products, services, royalties, rights, licensing or franchise fees?
If the respondent answered yes, they were asked follow-up questions regarding revenues from their exports and the percentage breakdowns of exports by country as well as into 1) goods; 2) services; and 3) royalties, rights, licensing and franchise fees.
The series of questions related to imports is identical to the above, except that the questions refer to “payments to suppliers outside Canada” rather than “revenue from clients outside Canada”.