Women arts and culture workers
2021 data, pandemic-related changes, and long-term trends
This post investigates a number of equity issues related to women arts and culture workers, including their share of the workforce, their share of hours worked, as well as recent and longer-term trends in these key statistics.
Key questions
Do women get paid for as many hours of arts and culture work as men?
Are there more women or men in the arts and culture workforce? Has that shifted over time?
There are some important things to keep in mind regarding strengths and limitations of the Labour Force Survey (LFS):
Until very recently, the LFS captured information related only to women and men, not people with diverse gender identities. Because of this limitation, this post only includes information on women and men.
This is a very “big picture” view. The definition of arts and culture workers includes 50 occupation groups, including heritage occupations (e.g., librarians, museum workers, archivists), cultural occupations (e.g., designers, editors, architects), and artists (i.e., performing arts creators and interpreters, visual artists, artisans, craftspeople, and writers). See this pdf file for details.
The LFS information is available only for the full group of 50 occupations, plus a subset of nine occupations (artists), not for other subsets or individual occupations. We cannot use this data request to understand differences in trends between workers in the arts, heritage, and cultural industries.
Hours worked provides one of the best indicators of changes over time, especially in a sector where self-employment is common. (Many self-employed people lose gigs – i.e., hours worked – when times are tough but may not technically lose their job.) 65% of artists and 28% of arts and culture workers are self-employed.
Income comparisons are not provided in this post. Because the LFS questionnaire captures salaries only (not self-employment earnings), and because of the high proportion of self-employed arts and culture workers, I did not ask for income data in my LFS request.
Yesterday’s unlocked post on longer-term trends for all artists and arts and culture workers contained many more details about using the LFS to measure the arts and culture workforce.
I’ve recently written about the situation of women artists. In this post, I’ll focus on the broader occupation grouping of arts and culture workers.
Key findings
Average hours worked per week: 13% lower for women arts and culture workers than men.
Women: 12.7 million hours of work
50% of hours worked in the arts and culture workers in 2021 (was just 38% in 1997)
436,000 women arts and culture workers
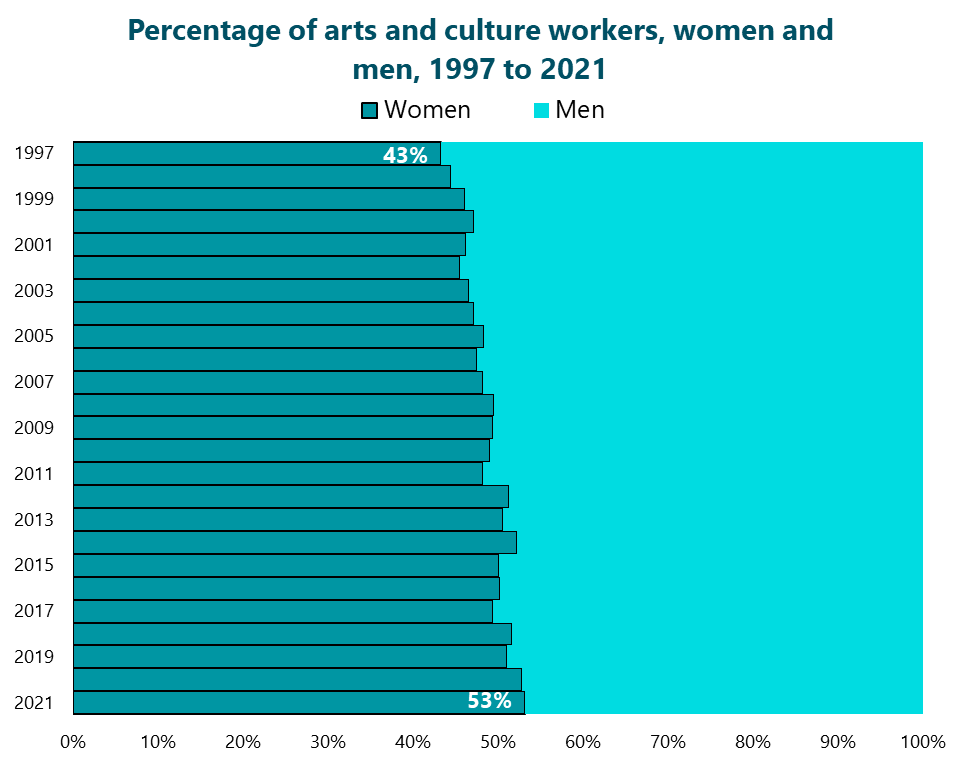
53% of arts and culture workers in 2021 (was just 43% in 1997)
Women arts and culture workers in 2021 and long-term trends
In 2021, the 436,000 women arts and culture workers logged 12.7 million hours of work. Women accounted for 53% of arts and culture workers in 2021, which is a significant increase from 43% in 1997 (when 228,000 women worked in an arts and culture occupation). Women’s share of all arts and culture positions (53%) is much higher than the average in the overall labour force (47%).
Note: The 2021 census, with its larger sample size, will provide a more definitive estimate of women arts and culture workers, but the LFS estimate is particularly useful for historical comparisons.
The total hours worked by women in arts and culture occupations in 2021 (12.7 million) is close to double their hours worked in 1997 (6.7 million).
Women accounted for one-half of the hours worked by all arts and culture workers in 2021. This proportion has risen steadily from just 38% in 1997. Women’s share of hours worked in the arts and culture (50%) is much higher than the average in the overall labour force (43%).
Still, women do not receive their full share of hours worked in the arts and culture: the average hours worked per week by women (29.0 hours at their main job) is 13% lower than the average for men (33.4). Women’s share of hours worked (50%) is lower than their proportion of arts and culture workers (53%). This LFS data request cannot provide insights into the reasons behind the lower share of hours worked by women arts and culture workers. It is possible that: more women work part-time hours (whether by choice or not); more women hold multiple jobs and work fewer hours at their main position; there is an uneven gender distribution in senior artistic roles that require more hours worked; and women with children bear more childcare responsibilities than men and are unable to work as many hours.
Pandemic-related changes
Between 2019 and 2021, the hours worked by women arts and culture workers increased by 12%. After a relatively small 3% decrease in 2020, hours worked by women arts and culture workers increased by 15% in 2021.
In comparison, the hours worked by men arts and culture workers increased by just 2% between 2019 and 2021. Men had a stronger reduction in hours worked in 2020 (-11%) and had the same percentage increase as women in 2021 (15%).
However, as noted above, the average hours worked per week in 2021 remained lower for women than men who work in the arts and culture (29.0 vs 33.4 hours, a 13% difference).
The changes in hours worked by all groups of arts and culture workers are higher than the equivalent changes for all workers during the pandemic.
Of note, pandemic-related changes for women artists were particularly challenging: a 5% decrease in hours worked between 2019 and 2021.


