Statistical Profile of Artists in Calgary in 2021
The city’s 7,000 professional artists have very low incomes, and nearly six in every ten artists are women
This article examines the demographics, employment situations, and incomes of professional artists in Calgary, based on custom data that Hill Strategies requested from Statistics Canada’s 2021 long-form census. The article also provides summary information about workers in arts leadership occupations and all occupations in the arts, culture, and heritage (a category that includes artists and arts leaders). Comparisons are provided with all workers in Calgary and all artists in Alberta.
The accompanying graphic summarizes some key findings of the research.
The article is made possible with the support of the Rozsa Foundation. Hill Strategies retained editorial control of the content.
How the census counts workers, including artists and other cultural workers
The occupational perspective from the census includes people who work across the economy, as long as they are classified into one of 10 artist occupation groups, 5 arts leadership occupation groups, or 52 cultural occupation groups.
In the census, artists must spend more time as artists than in any other occupation to be classified into an artist occupation group. More specifically, occupational data from the census are based on the number of people who worked more hours in an occupation than in any other between May 1 and 8, 2021, plus people who were not in the labour force at that time but had worked more in that occupation than any other between January of 2020 and May of 2021.
The prevalence of “gig work” and the often-atypical nature of artists’ workflows can make it challenging for official statistics to count artists as artists. As such, census estimates of the number of artists might be low.
The 52 occupation groups included as cultural workers include the 10 artist occupation groups as well as the 5 arts leadership occupation groups, plus many other cultural occupations (e.g., graphic designers, print operators, editors, translators, architects, and professionals in fundraising, advertising, marketing, and public relations), and heritage occupations (e.g., librarians, curators, and archivists). Because the count of cultural workers includes both artists and arts leaders, the number of artists and arts leaders should not be added to the number of cultural workers.
For a deeper dive on the occupation classifications, please see my articles on the methods behind choosing the 52 cultural occupation groups and the strengths and limitations of the census for counting artists and cultural workers.
Provincial and national context regarding artists, arts leaders, and all cultural workers
There are 18,100 professional artists who reside in Alberta, 9% of the 202,900 artists in Canada. As a percentage of the overall labour force, artists represent 0.7% in Alberta and 1.0% in Canada.
56,200 Canadians, including 3,600 Albertans, work in five occupation groups that are classified as arts leaders. Alberta accounts for 6% of Canada’s arts leaders, lower than the province’s 12% share of all workers. Readers should note that two arts leadership occupations (conductors / composers and producers / directors / choreographers) are also included as artists. As such, the number of arts leaders should not be added to the number of artists in any jurisdiction.
The broadest analysis relates to the 80,600 Albertans and 914,000 Canadians who work in arts, culture, and heritage occupations. These workers represent 3.3% of Alberta’s labour force and 4.4% of the Canadian labour force. The 52 occupation groups in this category include the ten artist occupation groups, the five arts leadership occupation groups, other cultural occupations (e.g., graphic designers, print operators, editors, translators, architects, and professionals in fundraising, advertising, marketing, and public relations), and heritage occupations (e.g., librarians, curators, and archivists).
Over 33,000 cultural workers in Calgary, including more than 7,000 artists
Census data indicate that there are 33,300 workers in arts, culture, and heritage occupations in Calgary, including 7,020 professional artists and 1,420 people who work in five occupation groups that are classified as arts leaders.
The 33,300 cultural workers represent 4.4% of all 764,100 workers in Calgary, much higher than the provincial average (3.3%) and equal to the national average (4.4%).
The 7,020 artists represent 0.9% of the city’s overall labour force, above the provincial average (0.7%) and just below the national average (1.0%). The concentration of artists in Calgary is similar to other Prairie cities, including Saskatoon (0.9%), Winnipeg (0.9%), Edmonton (0.8%), and Regina (0.8%).
Calgary’s artists had very low incomes in 2020
Income data from the census relate to the 2020 calendar year, which included significant slowdowns in artistic activity. Because of the challenging context in that year, the focus of this article is on overall personal incomes, with employment and household incomes provided as additional information. Personal income includes all sources, such as employment income, net revenue from self-employment, pandemic supports, rental income, investment income, and others.
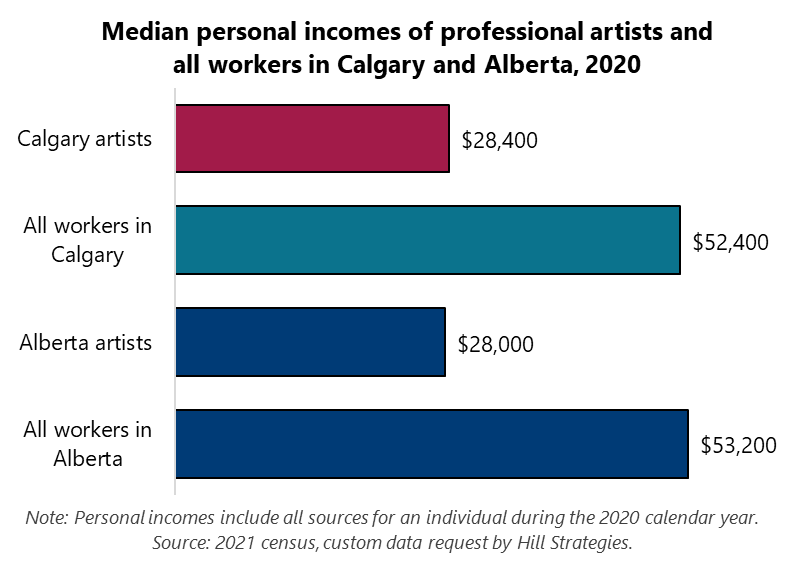
The graph below shows the median personal incomes of artists and all workers in Calgary and Alberta. The median personal income of Calgary artists (from all sources) was $28,400 in 2020, 46% lower than that of all workers in the city ($52,400). The median personal income of local artists is similar to the median for all of Alberta ($28,000). The difference in median personal income between artists and other workers in Calgary (-46%) is similar to the difference in all of Alberta (-47%) but is larger than the nationwide difference (-39%).
At $28,400, the median personal income of Calgary artists is 25% below the living wage in Calgary in 2020 ($37,700). Because the median income represents the point at which one-half of workers earn less and the other half earn more, this means that well over one-half of Calgary’s artists have incomes below the living wage.
Estimates of employment income include the work-related earnings of artists from all paid and self-employed positions that they held during the year. The median employment income of Calgary artists was just $11,800 in 2020, which is about one-quarter of the median employment income of all Calgary workers in the same year ($45,600). Despite the low earnings of artists in the city, their median employment income was slightly higher than the provincial average ($10,700) during a year that was incredibly difficult for many artists.
Household income provides a measure of the family situation of artists. Calgary artists, despite significant support from other members of their households, have median household incomes ($99,000) that are 22% lower than other workers in the city ($127,000). The median household income of Calgary artists is similar to the median of all Alberta artists ($100,000).
For all of the above statistics, median incomes were chosen as the key measurement, because the median should provide a better indication of the situation of a typical artist than the average (i.e., the “mean”), a statistic that is more strongly affected by a few individuals with very high incomes. All income statistics are shown before taxes.
Demographic and employment characteristics of Calgary artists
Of the 7,020 artists in Calgary:
69% are self-employed, more than four times the self-employment rate of all Calgary workers (15%) but similar to the rate of all Alberta artists (72%).
58% are women (which, for the census, includes some non-binary people), much higher than the proportion of all Calgary workers (48%) but lower than that of all Alberta artists (62%).
46% have a bachelor’s degree or higher, higher than the proportions of all Calgary workers (41%) and all Alberta artists (40%).
21% are members of racialized groups, much lower than the percentage of all Calgary workers (40%) but higher than that of all Alberta artists (17%).
4% are Indigenous, between the proportions of all Calgary workers (3%) and all Alberta artists (6%).
23% are immigrants to Canada, much lower than the proportion of all Calgary workers (38%) but higher than that that of all Alberta artists (18%).
4% are French speakers (i.e., official language minority), similar to the percentages of all Calgary workers (3%) and all Alberta artists (3%).
34% have a child at home, lower than the proportion of all Calgary workers (43%) but similar to that of all Alberta artists (35%).
24% are 55 years of age or older, which is slightly higher than the proportion of all Calgary workers (21%) but slightly lower than that of all Alberta artists (26%).
Calgary artists by occupation
As is the case in most jurisdictions, musicians are the largest artist occupation group in Calgary, representing about one in every five artists. From most to least common, the 7,020 artists in Calgary include:
1,500 musicians (21% of the city’s artists)
910 photographers (13%)
910 producers, directors, choreographers & related occupations (13%)
790 painters, sculptors & other visual artists (11%)
780 writers (11%)
710 artisans & craftspeople (10%)
550 dancers (8%)
520 actors, comedians & circus performers (7%)
260 other performers (4%)
90 conductors, composers & arrangers (1%)
Over 1,400 arts leaders in Calgary
There are 1,420 Calgary residents who work in five occupation groups that are classified as arts leaders, with the broad grouping of producers, directors, and choreographers accounting for nearly two-thirds of them. In Calgary, there are:
910 producers, directors, choreographers & related occupations (64% of the arts leaders in the city)
280 managers in publishing, motion pictures, broadcasting & performing arts (20%)
90 conductors, composers & arrangers (6%)
80 library, archive, museum & art gallery managers (6%)
60 conservators & curators (4%)
Note that the five arts leadership occupations are an imperfect approximation of the total number of people with senior level positions in the arts. “Arts leaders” is a category that Hill Strategies conceived of in 2022, based on a close examination of occupational classifications that are available from the census. While the grouping is quite broadly based, there are undoubtedly other senior workers in the sector who are not captured in the five occupation groupings. One example of known exclusions is directors and other senior managers in the arts, including those in arts associations. The occupation groupings for directors and senior managers are not separated based on the nature of their work or association (i.e., arts or other sectors of society). Similarly, government employees with an arts-related portfolio at any level of government are not separated based on their portfolios.
Summary information about cultural workers in Calgary
There are 33,300 workers in arts, culture, and heritage occupations in Calgary, representing 4.4% of the local labour force, much higher than the provincial average (3.3%) and equal to the national average (4.4%). One in every 23 workers in Calgary has a cultural occupation.
In 2020, a typical cultural worker in Calgary had:
Employment income of $40,000, 12% less than all Calgary workers ($45,600)
Total personal income of $47,200, 10% less than all workers in the city ($52,400)
Household income of $118,000, 7% less than all local workers ($127,000)


