
Arts sponsorships in 2024
Plus: 20-year trends

Today, I examine findings on sponsorships for arts organizations. This follows my analysis two weeks ago of high-level statistics on donations, donors, and sponsorships, as well as my article last week on individual donations to the arts, culture, and heritage. In the first article, I noted that overall sponsorship levels appear to have increased. What about arts sponsorships?
The article is based on a survey of sponsorships in 2024 (and versions from previous years), which has quite a small sample size but is the only source I found on this topic. The survey had 303 respondents, including sponsors, sponsorship recipients, and sponsorship agencies. Only 6% of respondents completed the survey in French, which calls into question the survey’s national representativeness. Despite its moderate sample size and imperfect representation across the country, the survey still offers some interesting findings about sponsorship, which (to my knowledge) is not well covered by another survey.
Sponsorships in 2024
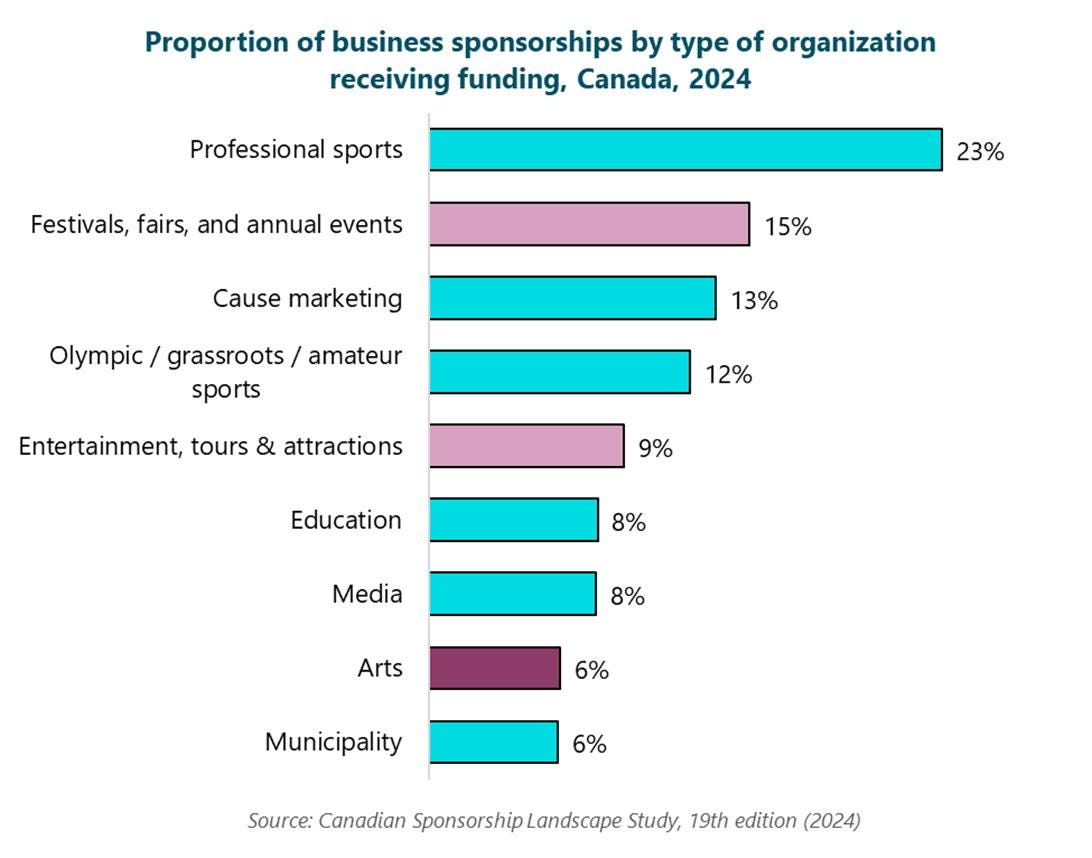
As I noted two weeks ago, brands invested $2.56 billion in sponsorship fees in 2024, according to the Canadian Sponsorship Landscape Study. Professional sports account for the largest share of sponsorships (23%).
The arts represent 6% of total sponsorship value in 2024, or roughly $154 million. (Oddly enough, this estimate is very close to Statistics Canada’s estimate of individual donations to the arts and culture in 2023: $157 million.)
The report includes an analysis of nine different “property types” (i.e., types of organizations receiving sponsorships). The arts rank eighth out of the nine types, as shown in the following graph.
Note that the report does not define the property types, including the arts (which is the term that they use). Other property types might include some arts activity, including “festivals, fairs, and annual events” and “entertainment, tours, and attractions”. I’ve chosen a light pink shading for these bars.
Largest single sponsorship and trends over time
Professional sports also receive the largest share (20%) of the highest-single-value sponsorship reported by sponsors. The arts account for just 1% of the highest value sponsorships, as shown in the second graph in today’s article.
Once again, other property types that might include some arts activity are shaded pink.
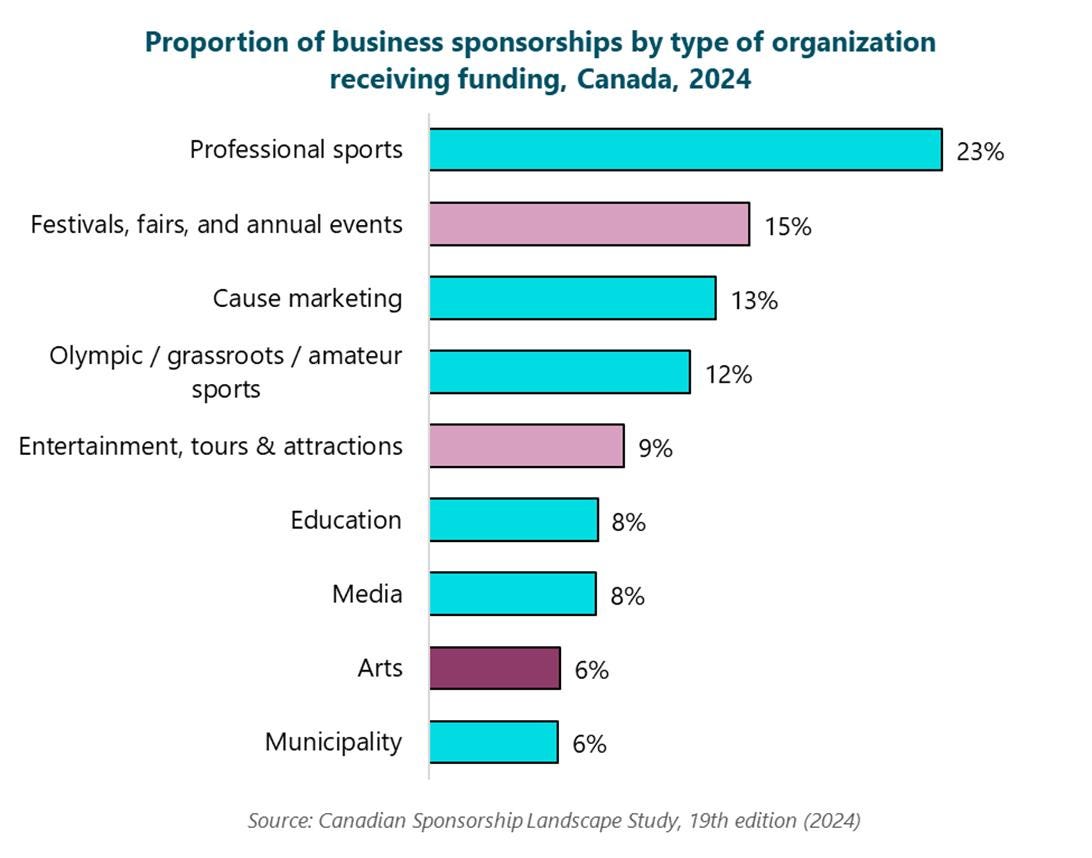
(Close readers will note that “Entertainment, tours, and attractions” was not included in the report data that I used for this graph, for unknown reasons.)
Sponsorship trends
The report includes a graph (p. 38) showing trends over time in the proportion of sponsorships by type of organization receiving funding. I’ve reproduced this graph below. Note that the small-ish sample size of the survey might be behind some of the swings in the annual estimates for many property types.
For the arts, my main takeaway from this graph is that the share of overall sponsorships is not growing. For the most part, it has remained relatively consistent over the past 11 years. However, before 2013, the arts did tend to account for a larger share of total sponsorships than the current estimate of 6%.
That being said, if there has indeed been an overall increase in sponsorship value, the most recent 6% for the arts would be a larger dollar value than 6% was 11 years ago.
My other key takeaway from the graph is that the arts (in tough to read beige-on-white) have long been lower down the list of recipient types.
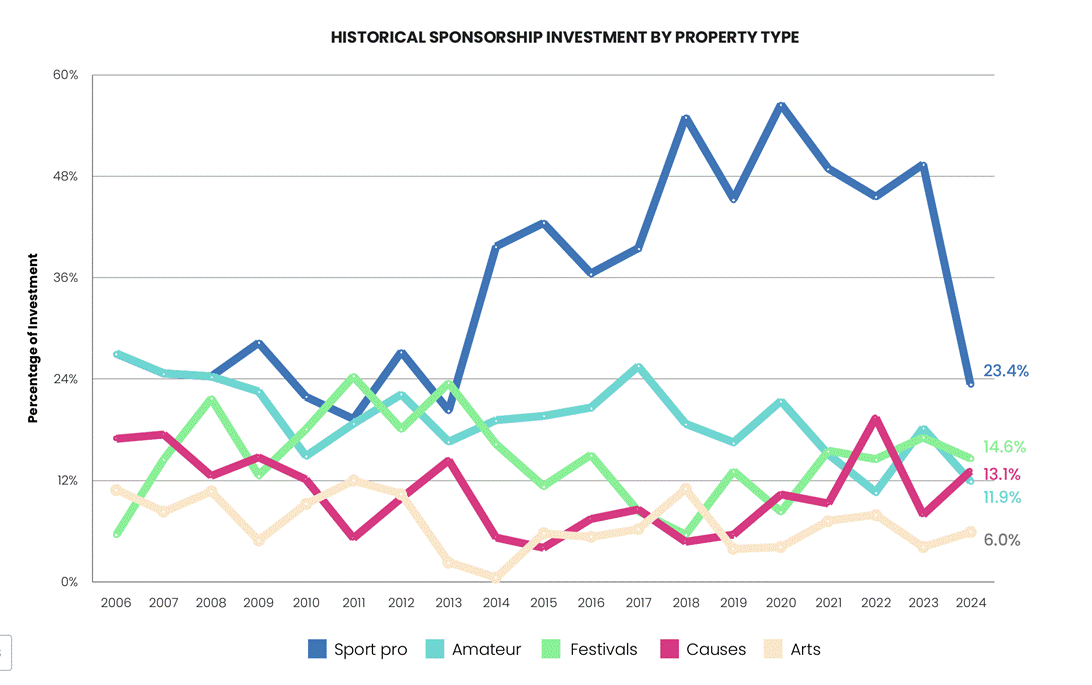
(Once again, close readers will note that this graph only includes five property types, not all nine that were included in some of the data in the report.)
Data source
Canadian Sponsorship Landscape Study (2024, 19th Annual). The T1 Agency, Dr. Norm O’Reilly (Lead author). https://www.thet1agency.com/canadian-sponsorship-landscape-study/ (sign-in required, but the report is free)