Perceived accessibility of arts and culture venues
Which groups of Canadians think that local cultural facilities are there for them?
How do perceptions of the accessibility of cultural facilities converge or diverge depending on aspects of demographics and identity?
Most of the time, I don't start analyzing a dataset or writing a post with a specific point in mind. Rather, I think that there might be an interesting nugget from dataset x, and I wonder what that nugget would show, if analyzed and brought to light.
Some posts end up painting the arts sector in a positive light. Others, like today, have a positive element within challenging findings. If you’re an optimist, keep reading to find out the one very positive finding in the post.
Today’s analysis deals with perceptions of the accessibility of cultural venues for different groups of people.
In June, I noted that “People in many equity-seeking groups are more likely than others to believe in the importance of the arts and culture during the pandemic”. Does this positive impression hold true for the perceived accessibility of cultural venues?
The data source is an Environics Research survey, conducted in February and March of 2021 for Canadian Heritage and the Canada Council for the Arts.
The survey asked respondents about their level of agreement with the statement: “I feel like I do not belong at the cultural facilities in my community.” Options: Strongly agree, somewhat agree, somewhat disagree, strongly disagree, not sure.
Note that no definition or description was provided for “cultural facilities in my community”.
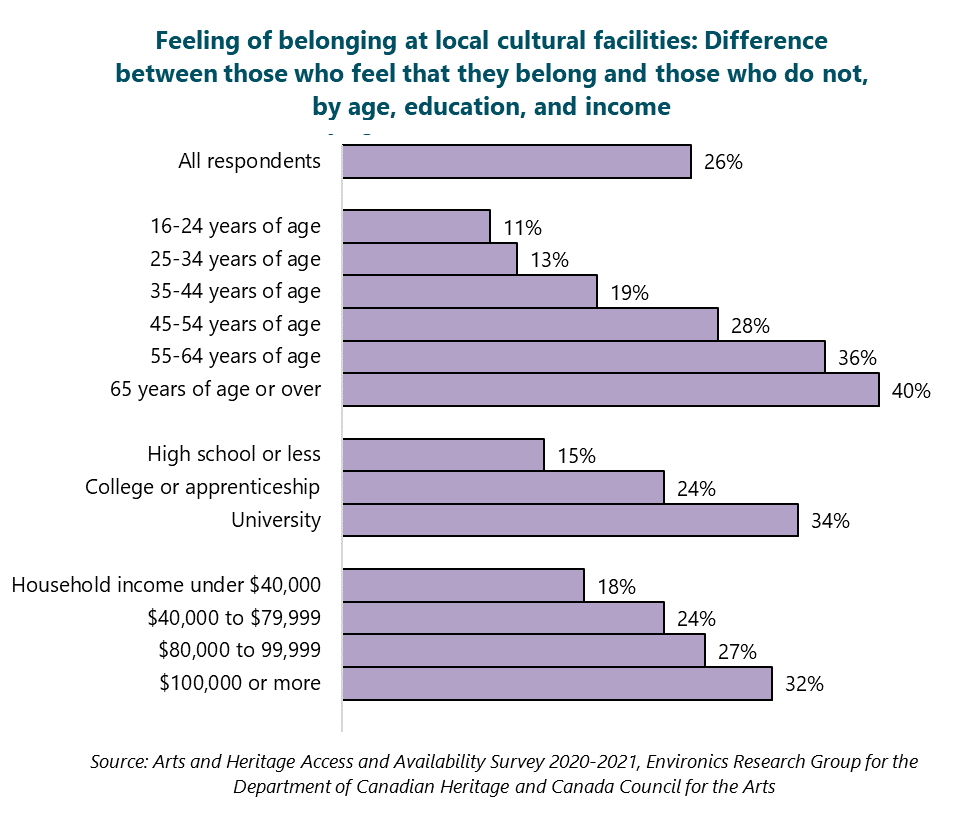
The survey question was phrased in the negative, but my analysis here shifts that to show the net positive ratings for different groups of people – the percentage saying that cultural facilities are accessible to them, minus those saying that such facilities are not accessible. This simplifies the findings and the graphs: higher percentages are better.
The survey’s large sample size – 10,000 Canadians 16 and older who reside in the 10 provinces – allows for an analysis of demographic differences. The report for the survey notes that the sample was drawn from an opt-in panel, and no margin of error was calculated.
Overall, many more Canadians believe that cultural facilities are accessible to them (57%) than believe that such facilities are not accessible (31%). This results in a “net positive” rating of 26% for all Canadians (the difference between the two percentages).
In all demographic groups, more people believe that they belong at local cultural facilities than not. But there are some significant differences.
This post investigates similarities and differences by:
Age
Education
Income
Racialized and non-racialized Canadians
Indigenous and non-Indigenous people
Urban and rural residents
Immigrants and non-immigrants
Gender
Sexual orientation
People who are disabled and those who are not
People who are D/deaf and those who are not
Languages spoken at home
Members of official language minorities
Demographic similarities and differences
Which groups are most likely to feel that they belong at local cultural facilities? Canadians who are older, university-educated, higher-income, white, and not disabled or deaf.
Three graphs are central to today’s post: each one shows similarities and differences in perceptions of the sense of belonging at local cultural facilities. The graphs show “net positive” reaction to the question, which is the difference between those who believe that they do belong minus those who believe that they do not.
Older, university-educated, and higher-income Canadians are much more likely to indicate that they belong at cultural facilities than other groups.
The first graph shows differences by age, education, and household income. For these demographic aspects, the feeling of belonging increases significantly. In other words, older, university-educated, and higher-income Canadians are much more likely to indicate that they belong at cultural facilities than other groups.
Further details of agreement and disagreement with the question (beyond the “net positive” indicator in the graphs) are provided in a very large data table at the end of this post.
White Canadians are much more likely to feel like they belong at local cultural facilities than Black, Asian, and Indigenous peoples.
The second graph highlights similarities and differences for various aspects of identity and demographics, including people who are racialized, Indigenous, and immigrants, as well as by size of municipality, gender, and sexual orientation. The findings?
White Canadians are much more likely to feel like they belong at local cultural facilities than Black, Asian, and Indigenous peoples.
Non-immigrants are somewhat more likely to feel like they belong than immigrants.
There is no perceptible difference by size of municipality.
Women are slightly more likely to feel like they belong than men, and both of these genders are much more likely to feel that they belong than gender diverse respondents.
Gay, lesbian, and straight Canadians are similarly likely to feel that they belong at cultural facilities, somewhat more than people with another sexual orientation.
Canadians who do not have a disability and are not deaf are much more likely to feel like they belong at local cultural facilities than disabled and D/deaf Canadians.
The final graph shows differences by disability, deafness, and language.
People who do not have a disability are much more likely to feel like they belong at local cultural facilities than disabled people.
Hearing Canadians are much more likely to feel that they belong at cultural facilities than D/deaf people.
People who speak French at home are more likely than English speakers to feel like they belong. Both of these groups are much more likely to say that they belong than speakers of other languages. The difference between Francophones and Anglophones is probably due to regional differences: Quebec residents are the most likely of all Canadians to say that they belong at local cultural facilities.
Majority-language speakers are a bit more likely to feel that they belong at local cultural facilities than people from official language minority groups.


