Demographic differences in perceptions of the benefits of the arts and culture for personal wellbeing during the pandemic
Advocacy alert! The arts may have a perception problem, and it’s not among the groups you might guess.
Yesterday, I identified what I called a “wellbeing deficit” during the pandemic: more Canadians believe that the arts and culture have NOT been important to their wellbeing during the pandemic than believe that the arts and culture have been important.
Today, we’ll see whether there are demographic differences in this key indicator.
Like yesterday, the main data source is a survey in February and March of 2021 conducted by Environics Research Group for Canadian Heritage and the Canada Council for the Arts.
The survey’s large sample size – 10,220 Canadians 16 and older who reside in the 10 provinces – is perfect for an examination of demographic differences. The report for the survey notes that the sample was drawn from an opt-in panel, and no margin of error was calculated.
Territorial statistics are available but not reported here. A separate telephone survey was conducted in the three territories, but the results related to the benefits questions may not be comparable between the territories and the provinces, because of the different mode of contact.
Provincial differences will be examined in a separate post next week.
Respondents were asked about their level of agreement with the statement: “During the COVID 19 pandemic, arts and cultural activities have been important for my personal wellbeing.” (Options: Strongly agree, somewhat agree, somewhat disagree, strongly disagree, unsure.)
What are the similarities and differences in perceptions of the importance of the arts and culture for personal wellbeing during the pandemic for various aspects of demographics and identity?
This post investigates similarities and differences by:
Gender
Age
Education
Income
People who are D/deaf and those who are not
People who are disabled and those who are not
Sexual orientation
Immigrants and non-immigrants
Languages spoken at home
Members of official language minorities
Urban and rural residents
People in many equity-seeking groups are more likely than others to believe in the importance of the arts and culture during the pandemic
As I noted on Monday, a minority of survey respondents (40%) agree that “arts and cultural activities have been important for your personal wellbeing during the pandemic” (10% strongly agree and 30% somewhat agree). On the other hand, 48% disagree (18% strongly and 30% somewhat). My measure of “net agreement” is -8%, meaning that 8% more Canadians disagree than agree with the statement.
Binging Netflix shows or Spotify playlists may not have been perceived as arts and cultural activities during the pandemic — or they were not seen to be important for personal wellbeing. This narrower view of the arts and culture is consistent with the preceding survey language, which equated arts and cultural events with performing arts, visual arts, Indigenous arts, cultural festivals, museums, science centres, historic sites, archives, zoos, aquariums, and botanical gardens (but not film and TV).
Below, I offer three charts to highlight similarities and differences in perceptions for different groups of Canadians.
All three graphs show net agreement with the statement about arts and culture activities being important to personal wellbeing during the pandemic. Net agreement is the difference between those who agree (either strongly or somewhat) minus those who do not agree (either not at all or not very much). See the end of this post for the full math of agreement and disagreement for each group.
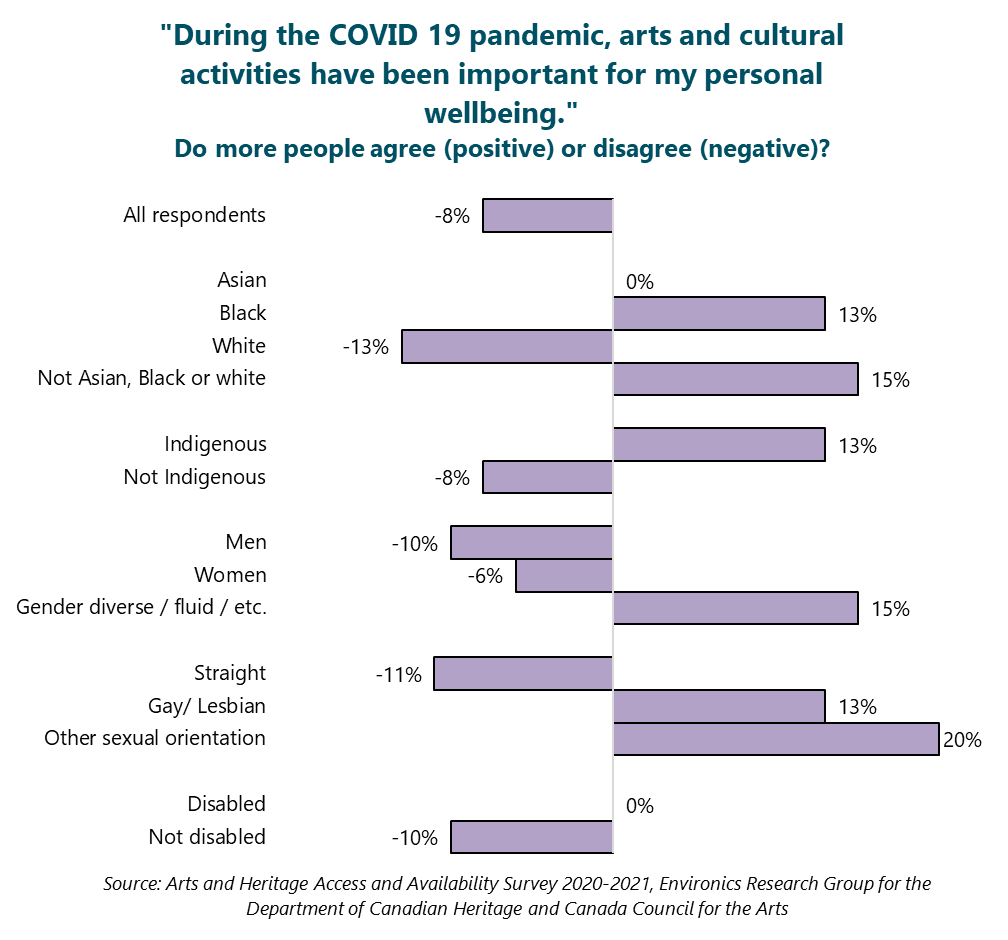
The arts appear to have a straight, white people problem – in terms of perceptions of value, not access. (That’s a post for another day).
As shown in the following chart, there are groups where more people believe in the importance of the arts and culture during the pandemic than those who don’t:
Black Canadians
Canadians who are not Black, Asian, or white
Indigenous peoples
People who are non-binary, gender diverse, gender fluid, etc.
Gay and lesbian Canadians, plus those who do not identify as straight or gay/lesbian.
Disabled Canadians (much more than those who are not disabled)
Who tends NOT to believe in the importance of the arts and culture during the pandemic?
White Canadians
Non-Indigenous Canadians
Men and women
Straight people
Canadians who are not disabled
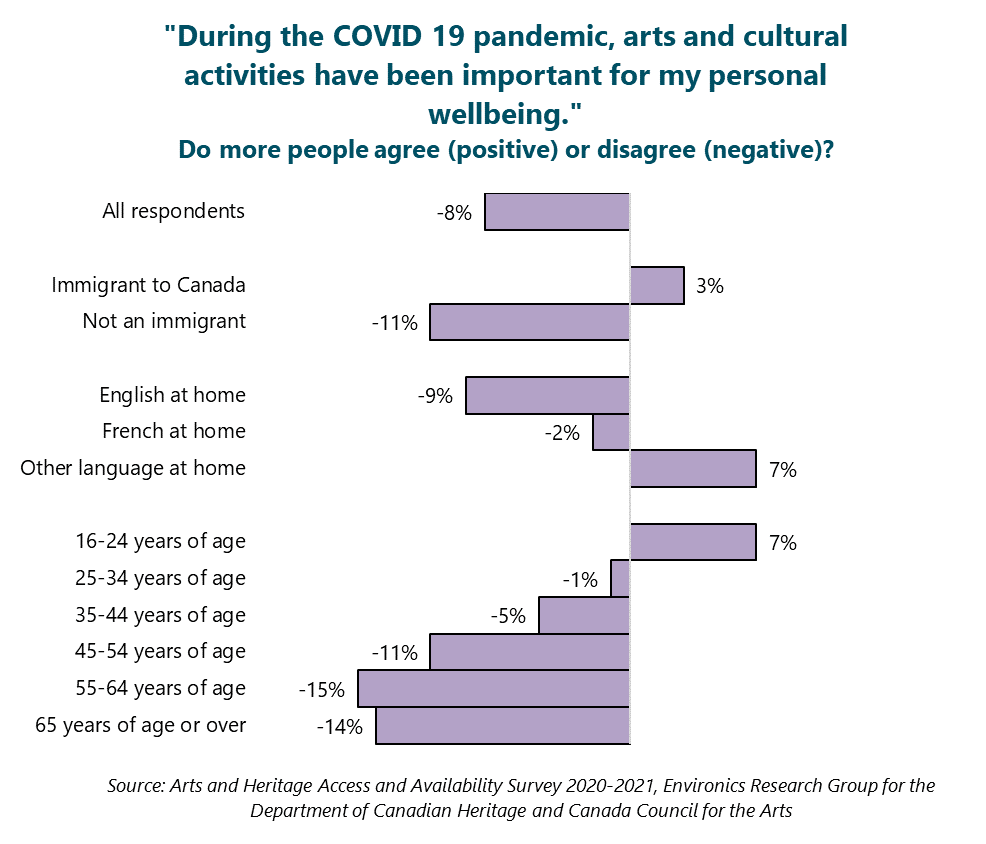
Immigrants and Canadians under 25 years of age are more likely than others to agree that the arts and culture have been important for their wellbeing during the pandemic.
The following chart shows other characteristics where there are major differences in the perception of the value of the arts and culture during the pandemic:
Immigrants Canadians are much more likely than non-immigrants to believe that arts and culture activities have been important for their personal wellbeing during the pandemic.
Those who speak neither French nor English at home are much more likely than English or French speakers to believe in the importance of the arts and culture during the pandemic.
The youngest group of Canadians surveyed (16 to 24 years of age) are much more likely than people in other age groups to believe in the importance of the arts and culture during the pandemic.
Rural / remote residents, people with a high school education or less, and higher income people (!) are less likely than others to agree that the arts and culture have been important for their wellbeing during the pandemic.
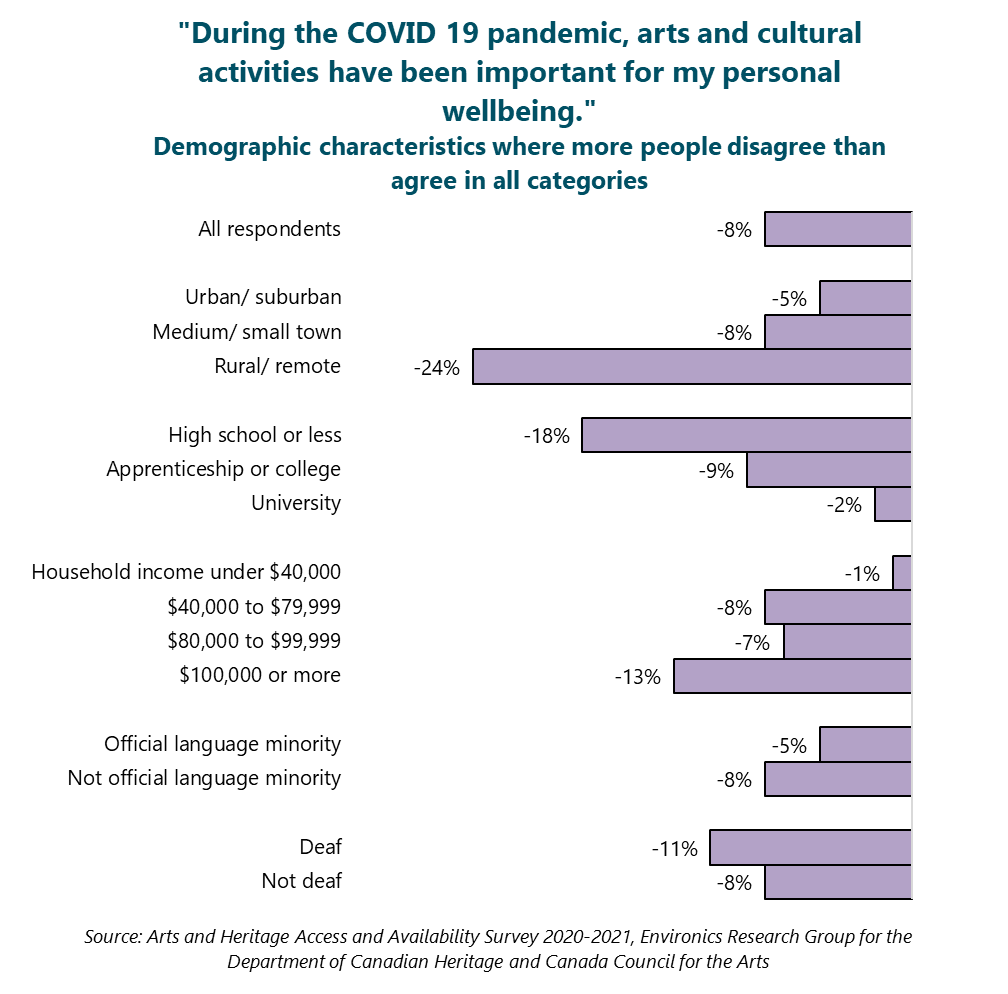
The final chart shows that, for some characteristics, all groups are more likely to disagree than agree with the importance of the arts and culture during the pandemic. However, there are still some differences within most of these characteristics:
Urban or rural residence
Education
Household income
Official language minority groups
Canadians who are or are not D/deaf
Data: Arts and culture activities have been important for personal wellbeing during the pandemic
Excel file for download with the statistics from the above graphs. Text version below.
Source: Arts and Heritage Access and Availability Survey 2020-2021, Environics Research Group for the Department of Canadian Heritage and Canada Council for the Arts.
All respondents. Agree: 40%. Disagree: 48%. Agree minus disagree: -8%.
Asian. Agree: 44%. Disagree: 44%. Agree minus disagree: 0%.
Black. Agree: 50%. Disagree: 37%. Agree minus disagree: 13%.
White. Agree: 38%. Disagree: 51%. Agree minus disagree: -13%.
Not Asian, Black or white. Agree: 52%. Disagree: 37%. Agree minus disagree: 15%.
Indigenous. Agree: 51%. Disagree: 38%. Agree minus disagree: 13%.
Not Indigenous. Agree: 40%. Disagree: 48%. Agree minus disagree: -8%.
Men. Agree: 39%. Disagree: 49%. Agree minus disagree: -10%.
Women. Agree: 41%. Disagree: 47%. Agree minus disagree: -6%.
Non-binary, gender diverse, etc.. Agree: 54%. Disagree: 39%. Agree minus disagree: 15%.
Straight. Agree: 39%. Disagree: 50%. Agree minus disagree: -11%.
Gay/ Lesbian. Agree: 51%. Disagree: 38%. Agree minus disagree: 13%.
Other sexual orientation. Agree: 55%. Disagree: 35%. Agree minus disagree: 20%.
Disabled. Agree: 45%. Disagree: 45%. Agree minus disagree: 0%.
Not disabled. Agree: 39%. Disagree: 49%. Agree minus disagree: -10%.
Immigrant to Canada. Agree: 45%. Disagree: 42%. Agree minus disagree: 3%.
Not an immigrant. Agree: 39%. Disagree: 50%. Agree minus disagree: -11%.
English at home. Agree: 40%. Disagree: 49%. Agree minus disagree: -9%.
French at home. Agree: 43%. Disagree: 45%. Agree minus disagree: -2%.
Other language at home. Agree: 47%. Disagree: 40%. Agree minus disagree: 7%.
16-24 years of age. Agree: 48%. Disagree: 41%. Agree minus disagree: 7%.
25-34 years of age. Agree: 43%. Disagree: 44%. Agree minus disagree: -1%.
35-44 years of age. Agree: 41%. Disagree: 46%. Agree minus disagree: -5%.
45-54 years of age. Agree: 39%. Disagree: 50%. Agree minus disagree: -11%.
55-64 years of age. Agree: 37%. Disagree: 52%. Agree minus disagree: -15%.
65 years of age or over. Agree: 38%. Disagree: 52%. Agree minus disagree: -14%.
Urban/ suburban. Agree: 42%. Disagree: 47%. Agree minus disagree: -5%.
Medium/ small town. Agree: 39%. Disagree: 47%. Agree minus disagree: -8%.
Rural/ remote. Agree: 32%. Disagree: 56%. Agree minus disagree: -24%.
High school or less. Agree: 34%. Disagree: 52%. Agree minus disagree: -18%.
Apprenticeship or college. Agree: 40%. Disagree: 49%. Agree minus disagree: -9%.
University. Agree: 44%. Disagree: 46%. Agree minus disagree: -2%.
Household income under $40,000. Agree: 42%. Disagree: 43%. Agree minus disagree: -1%.
$40,000 to $79,999. Agree: 40%. Disagree: 48%. Agree minus disagree: -8%.
$80,000 to $99,999. Agree: 41%. Disagree: 48%. Agree minus disagree: -7%.
$100,000 or more. Agree: 38%. Disagree: 51%. Agree minus disagree: -13%.
Official language minority. Agree: 42%. Disagree: 47%. Agree minus disagree: -5%.
Not official language minority. Agree: 40%. Disagree: 48%. Agree minus disagree: -8%.
Deaf. Agree: 40%. Disagree: 51%. Agree minus disagree: -11%.
Not deaf. Agree: 40%. Disagree: 48%. Agree minus disagree: -8%.


