Representation of Muslim workers among professional artists, arts leaders, and all cultural workers in Canada
First-ever study of the 3,900 artists and nearly 28,000 cultural workers who are Muslim
This article examines the representation of Muslim workers in 4 broad groupings of occupations, based on data from the 2021 census:
Professional artists
Arts leaders
All workers in the arts, culture, and heritage
All Canadian workers
Information about occupation groups included in these categories is available throughout the report.
Data on Muslim workers are drawn from the census question: “What is this person’s religion?” This was a write-in question that included the following notes and tips:
“Indicate a specific denomination or religion even if this person is not currently a practising member of that group.”
“For example, Roman Catholic, United Church, Anglican, Muslim, Baptist, Hindu, Pentecostal, Lutheran, Presbyterian, Sikh, Buddhist, Jewish, Greek Orthodox, etc.” (These 13 examples of denominations and religions are in the order of their response frequency in 2011.)
“Specify one denomination or religion only.”
Respondents could also select “no religion”.
(Sources: Religion Reference Guide, Census of Population, 2021 and long-form census questionnaire)
Other notes about methods are provided at the end of this article.
This article is one of two released today, both commissioned by the Inspirit Foundation. The other statistical article, on Muslim incomes in the arts, culture, and heritage, can be found here. A full report on the Muslim Artists Live Here project, containing qualitative information and select statistics, is available on the Inspirit Foundation website.
General statistics on Muslim workers in Canada
868,100 Canadian workers identify as Muslim, or 4% of all 20.6 million workers.
Canadians of a Muslim faith are as likely as other Canadians to be in the labour force, whether employed or looking for work (63.4% of Muslim Canadians vs. an average of 63.7% for all Canadians). However, using census calculations, the unemployment rate is much higher among Muslim Canadians (16.7%) than other Canadian workers (10.3%).
The representation of Muslim people is lower in the arts and culture than in the overall labour force
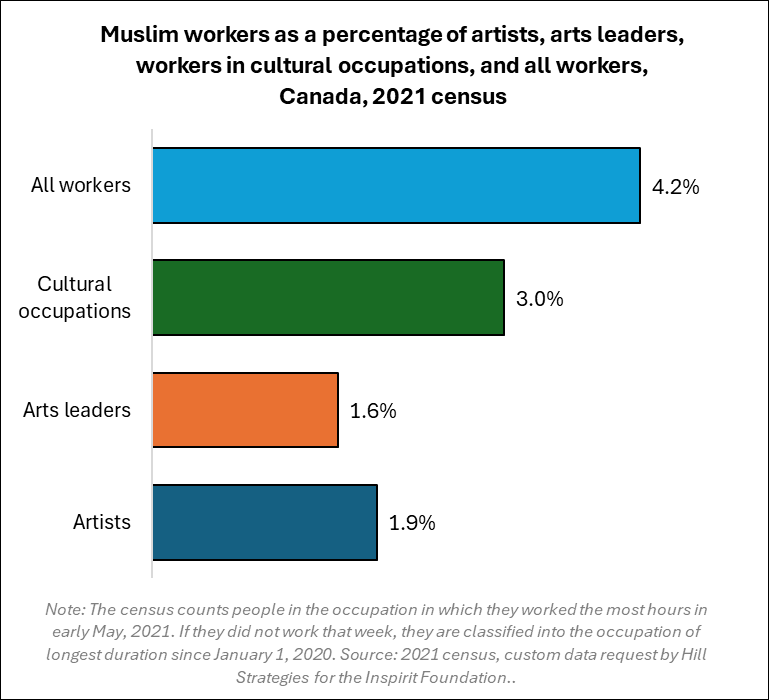
The following graph highlights the proportions of artists, arts leaders, all cultural workers, and all workers in Canada who are Muslim. The graph demonstrates that Muslim Canadians are underrepresented in all arts and culture occupation groupings.
Artists, arts leaders, and cultural workers by religion
Artists
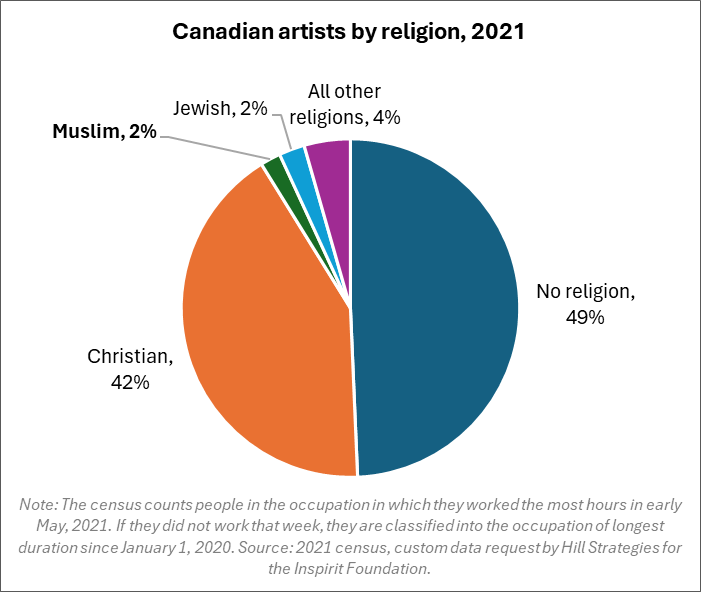
3,900 of Canada’s 202,900 artists are Muslim (2%), much lower than Muslim people’s share of the Canadian labour force (4%). As shown in the following graph, the largest proportions of artists have no religious affiliation (49%) or are of a Christian faith (42%). “All other religions” contains many faiths, none of which accounts for more than 1% of Canadian artists.
For more information about the 202,900 professional artists who reside in Canada, please see an article related to all Canadian artists. The 10 artist occupation groups are listed in a subsequent section, as well as in the article on all Canadian artists.
Artists as a percentage of the overall labour force
Professional artists represent 1.0% of all Canadian workers but only 0.5% of all Muslim workers in Canada. One in every 221 Muslim workers is an artist (compared with an average of 1 in 102 workers).
For people of other faiths, the concentrations of artists are:
2.6% for Jewish people
1.8% for people with a traditional (North American Indigenous) spirituality
1.3% for people with no religious affiliation
1.1% for Buddhists
0.8% for Christians
0.3% for Hindus
0.2% for Sikhs
2.4% for people with another religion or spiritual tradition
Muslim artists by occupation
The 3,900 Muslim artists include:
650 producers, directors, choreographers and related occupations (17% of all Muslim artists)
620 writers (16%)
560 photographers (14%)
540 musicians (14%)
490 visual artists (12%)
400 artisans and craftspeople (10%)
330 actors, comedians, and circus performers (8%)
170 other performers (4%)
120 dancers (3%)
50 conductors, composers, and arrangers (1%)
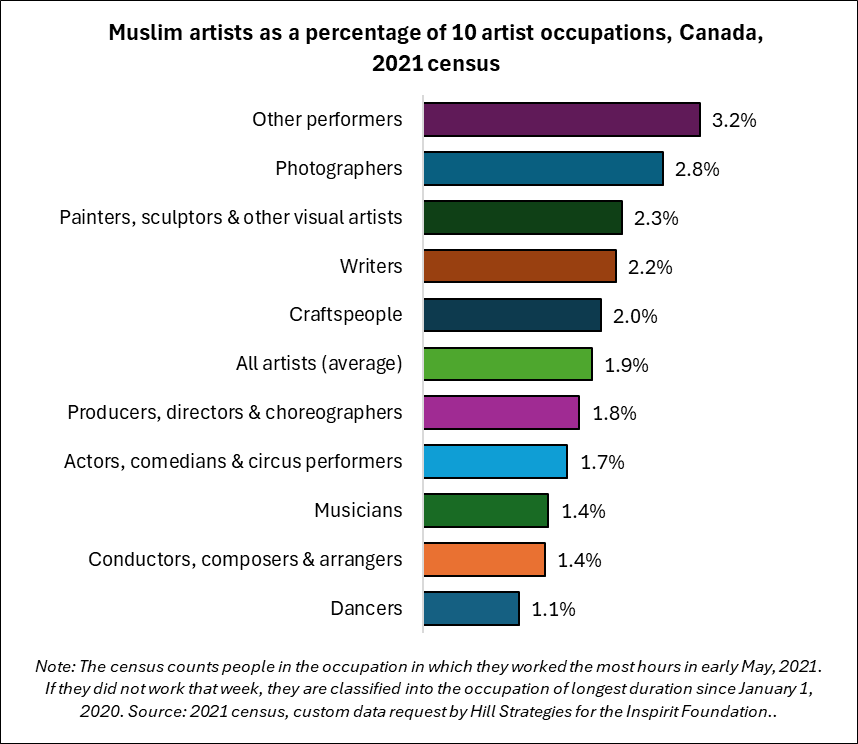
As a percentage of all artists in each occupation group, Muslim artists represent very different amounts. As shown in the following graph, the percentages of artist occupation groups represented by Muslim artists are:
3.2% of other performers, a grouping that includes buskers, DJs, puppeteers, face painters, and many other occupations, but excludes actors, musicians, dancers, conductors, etc.
2.8% of photographers
2.3% of painters, sculptors, and other visual artists
2.2% of writers
2.0% of craftspeople
1.8% of producers, directors, choreographers, and related occupations
1.7% of actors, comedians, and circus performers
1.4% of musicians
1.4% of conductors, composers, and arrangers
1.1% of dancers
Arts leaders
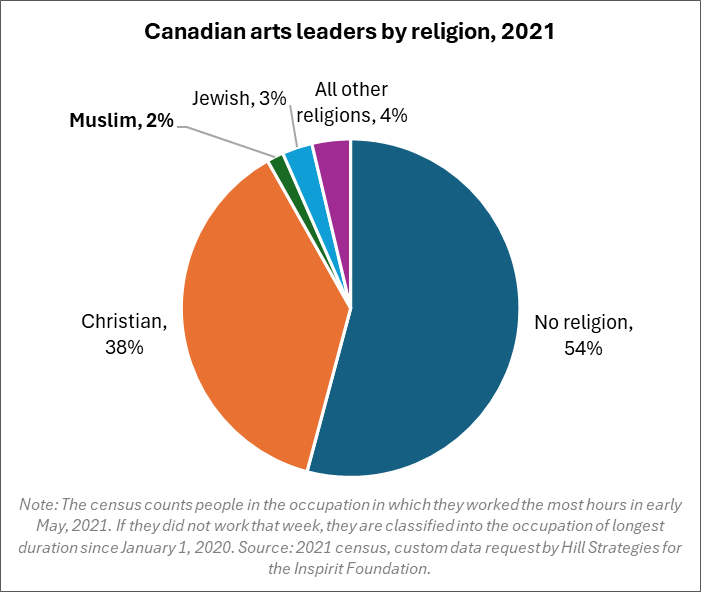
Among Canada’s 56,200 arts leaders, 900 are Muslim (2%). Five occupation groups are included in the counts of arts leaders:
Producers, directors, choreographers, and related occupations (36,200 workers in Canada, including 650 Muslim workers)
Managers in publishing, motion pictures, broadcasting, and the performing arts (8,800 workers, including 140 Muslim workers)
Library, archive, museum, and art gallery managers (5,100 workers, including 40 Muslim workers)
Conductors, composers, and arrangers (3,900 workers, including 50 Muslim workers)
Conservators and curators (2,200 workers, including fewer than 40 Muslim workers)
The following graph shows the proportions of arts leaders for the largest religious groups.
“Arts leaders” is a category that Kelly Hill (President of Hill Strategies) conceived of based on a close examination of Statistics Canada’s occupational classifications, in particular the 52 occupation groups included as cultural workers. This category does not capture all senior-level workers in the arts. Many are excluded from culture specific counts due to the lack of fine-grained information in standard occupation categories. Some examples of occupations that could be considered arts leaders but are grouped into other, non-culture-specific occupation groups include:
Directors and other senior managers in the arts and culture, including arts associations. Association directors and senior managers are not separated based on the nature of their work or association.
Government employees with a cultural portfolio at any level of government. Government workers are not separated based on their portfolios.
Arts consultants and researchers.
Because two arts leadership occupations are also included as artists, the number of arts leaders should not be added to the number of artists. Artists and arts leaders are both included in the counts of cultural workers in the following section.
Cultural workers
914,000 Canadians work in 52 occupation groups in the arts, culture, and heritage. These workers represent 4.4% of the Canadian labour force. The 52 occupation groups in this category include the 10 artist occupation groups as well as the 5 arts leadership occupation groups, other cultural occupations (e.g., graphic designers, print operators, editors, translators, architects, and professionals in fundraising, advertising, marketing, and public relations), and heritage occupations (e.g., librarians, curators, and archivists).
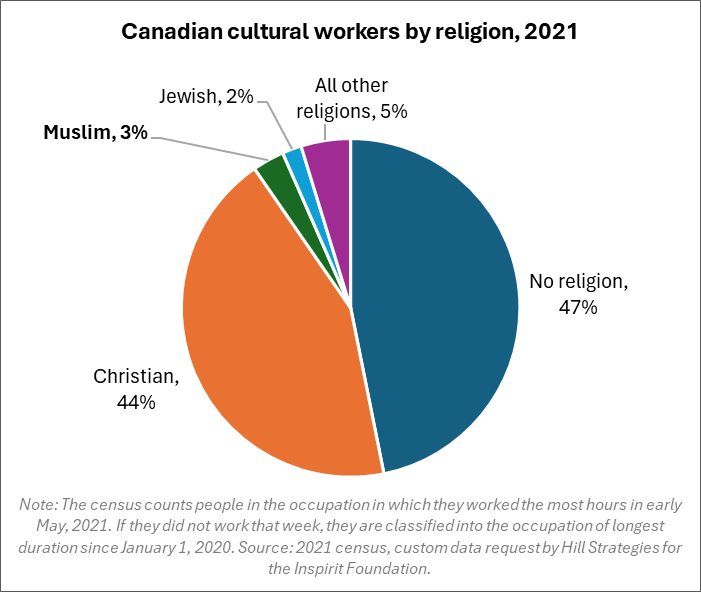
3% of all cultural workers in Canada are Muslim (27,800). Large proportions of cultural workers either have no religious affiliation (47%) or are Christian (44%), as shown in the following graph.
Cultural workers as a percentage of the overall labour force
Cultural workers of a Muslim faith represent 3.2% of all Muslim workers in Canada, lower than the Canadian average (4.4% of all Canadian workers). One in every 31 Muslim workers is a cultural worker (compared with an average of 1 in 23 workers).
Secular arts and culture
The arts and culture are particularly secular areas of society, as shown by high proportions of workers with no religious affiliation:
Artists: 49% have no religious affiliation
Arts leaders: 54%
Cultural workers: 47%
All workers 36%
Christians represent a slight majority of all Canadian workers (52%) but much smaller proportions of artists (42%), arts leaders (38%), and cultural workers (44%).
Notes on methods
The analysis relates to professional workers, but with a very specific concept of professional. Census data on occupations include people who worked more hours as an artist than at any other occupation between May 1 and 8, 2021, plus people who were not in the labour force at that time but had worked more as an artist than at another occupation between January of 2020 and May of 2021. Part-time artists who spent more time at another occupation in May of 2021 would be classified in the other occupation. (The same would be true of workers in arts leadership occupations and all cultural occupations.)
The occupational perspective counts people who work across the economy, as long as they are classified into one of 10 artist occupation groups, 5 arts leadership occupation groups, or 52 cultural occupation groups. Details about the occupation groups included in each of the categories is available in a recent article, which also outlined the methods behind choosing the 52 cultural occupation groups. Another article highlighted some strengths and limitations of the census for counting artists and cultural workers. In this article, no estimates of fewer than 40 people are presented in order to ensure confidentiality and data reliability.
The challenging context of the pandemic in the spring of 2021 is important to keep in mind when interpreting census data on artists, which were collected in May of 2021. Income data from the census relate to the 2020 calendar year.


