Are immigrants to Canada well represented among professional artists, arts leaders, and all cultural workers?
The 43,000 immigrant artists represent over 20% of all artists
During a recent discussion with colleagues at the Inspirit Foundation, I was reminded of the common perception that immigrants to Canada may be reluctant to pursue careers as artists, at least for the first generation. In addition, immigrants may face barriers in terms of the recognition of their skills and experience as professional artists.
I thought, hmm, I have the data to analyze that! So here we are.
Today’s post examines the number and representation of immigrants to Canada within four broad groupings of occupations, based on data that I commissioned from the 2021 census: professional artists, arts leaders, workers in cultural occupations, and all Canadian workers. The post examines differences between racialized and non-racialized immigrants, differences by period of immigration, and differences between immigrants and second- and third-generation Canadians. A quick summary of immigrants by artist occupation is also provided.
The post does not include an analysis of the incomes of immigrant workers, which I am planning for next week. I am also planning a post with provincial and territorial analyses, likely in two weeks.
Note that people with permanent resident status are excluded from these statistics. Other notes regarding methods are provided at the end of this post.
Just over one-fifth of professional artists in Canada are (first-generation) immigrants
The following graph shows that immigrant workers are under-represented in the arts, culture, and heritage, especially in arts leadership positions. Canada is home to:
43,000 immigrant artists, representing 21% of the country’s 202,900 artists.
10,300 arts leaders, or 18% of all 56,200 arts leaders.
213,200 workers in cultural occupations, or 23% of all 914,000 cultural workers.
As a benchmark, the 5.3 million immigrant workers in Canada represent 25% of all workers.
Racialized and non-racialized immigrants
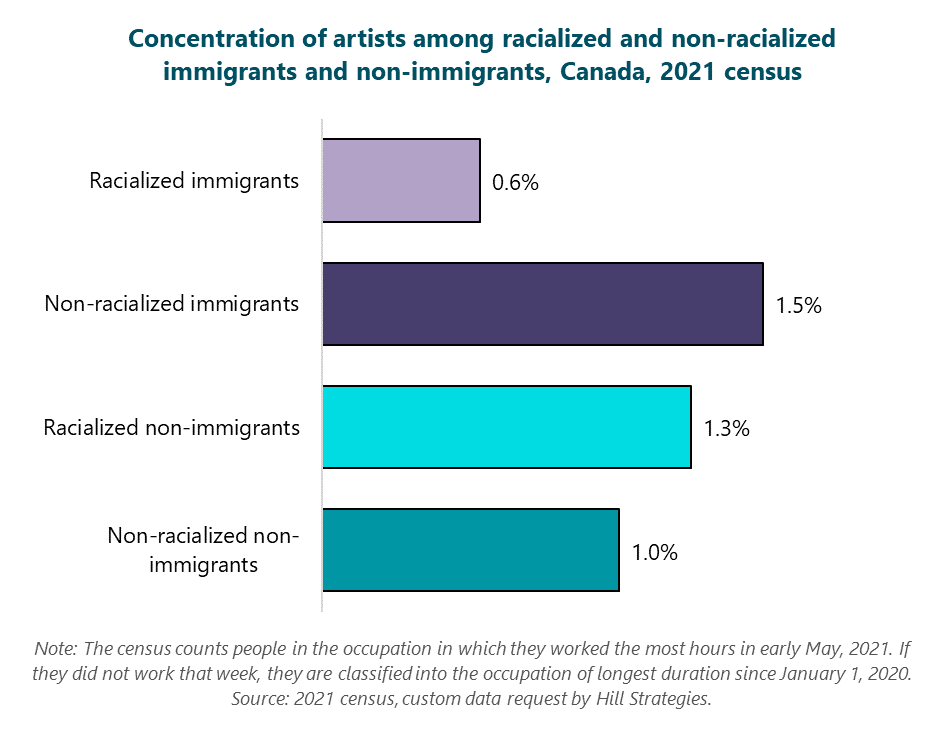
There are substantial differences in the propensity and opportunity to be a professional artist between racialized and non-racialized immigrants, compared with the percentage of all workers in the same groups.
Overall, 0.8% of immigrants are artists (compared with 1.1% of non-immigrants). As shown in the graph below:
Only 0.6% of racialized immigrants are professional artists.
1.5% of non-racialized immigrants are professional artists.
In comparison, 1.3% of racialized non-immigrants are professional artists, as are 1.0% of non-racialized non-immigrants.
For context, exactly one-half of all immigrant artists are racialized, compared with just 9% of non-immigrant artists.
Immigrant artists by period of immigration
This section examines the similarities and differences in the propensity and opportunity to become a professional artist based on when someone immigrated.
The graph below shows that there are slight differences by period of generation:
Among the most recent immigrants to Canada (between 2016 and May of 2021), 0.8% are professional artists.
0.7% of people who immigrated to Canada between 2011 and 2015 are professional artists.
Similarly, 0.7% of people who immigrated to Canada between 2001 and 2010 are professional artists.
The highest concentration of artists (1.0%) is among people who immigrated to Canada before 2001.
In comparison, 1.1% of Canadians who are not immigrants are artists.
Artists by generation of immigration
Are immigrants’ children (i.e., second-generation Canadians) or grandchildren (i.e., third-generation Canadians) more likely to become professional artists than the immigrants themselves? (Only first-generation immigrants were included in the above statistics.)
The answer to my question is yes, but with a twist. As shown in the graph below, 0.8% of immigrants to Canada are professional artists. The concentration of artists rises to 1.3% for second-generation Canadians but falls to 1.0% for third-or-more-generation Canadians.
Immigrant artists by occupation
As a percentage of all Canadians in 10 artist occupation groups, immigrants account for the highest percentage of visual artists (25% of all painters, sculptors, and other visual artists). As depicted in the graph below, immigrants represent the following percentages of workers in each artist occupation group:
25% of painters, sculptors, and other visual artists (5,400 immigrant artists)
24% of photographers (4,900 immigrant artists)
24% of musicians (8,900 immigrant artists)
22% of craftspeople (4,400 immigrant artists)
20% of conductors, composers, and arrangers (770 immigrant artists)
19% of other performers, a grouping that includes buskers, DJs, puppeteers, face painters, and many other occupations, but excludes actors, musicians, dancers, conductors, etc. (1,000 immigrant artists)
19% of actors, comedians, and circus performers (3,800 immigrant artists)
19% of writers (5,300 immigrant artists)
19% of producers, directors, choreographers, and related occupations (6,800 immigrant artists)
17% of dancers (1,800 immigrant artists)
Overall, there are 43,000 immigrant artists in Canada, representing 21% of all artists.
Notes on methods
As with my other census analyses, this post relates to a very specific concept of professionals. Census data on occupations include people who worked more hours as an artist than at any other occupation between May 1 and 8, 2021, plus people who were not in the labour force at that time but had worked more as an artist than at another occupation between January of 2020 and May of 2021. Part-time artists who spent more time at another occupation in May of 2021 would be classified in the other occupation. (The same would be true of workers in arts leadership occupations and all cultural occupations.)
The occupational data in the census include people who work across the economy, as long as they are classified into one of 10 artist occupation groups, 5 arts leadership occupation groups, or 52 cultural occupation groups. Details about the occupation groups included in each of the categories is available in a Canada-wide article, which also outlined the methods behind choosing the 52 cultural occupation groups. Another article highlighted some strengths and limitations of the census for counting artists and cultural workers.


