Environmental practices of arts, heritage, and entertainment organizations and businesses
Canadian and provincial analysis of self-reported practices
Earlier this year, I wrote a fairly broad-based post about the linkages between the arts and the environment and concluded that “more can be done to align the arts with climate solutions, given the importance of the arts in environmental activism, the quite average level of environmental practices and policies by arts organizations, and a policy disconnect between the arts and the environment”.
Today’s post will provide a more focused analysis of new data on the presence or absence of environmental practices among arts, heritage, and entertainment organizations and businesses (with at least one employee). I’ll also highlight some key statistics for each province, in addition to the pan-Canadian analysis.
My analysis shows that …
Most arts, heritage, and entertainment organizations and businesses are engaged in some type of environmental practice, but few have a written policy or measure their footprint.
The analysis is based on the following question, included in a survey that Statistics Canada conducted between July 4 and August 8, 2022:
Which of the following environmental practices does this business or organization have currently in place or plan to implement over the next 12 months?
Select all that apply.
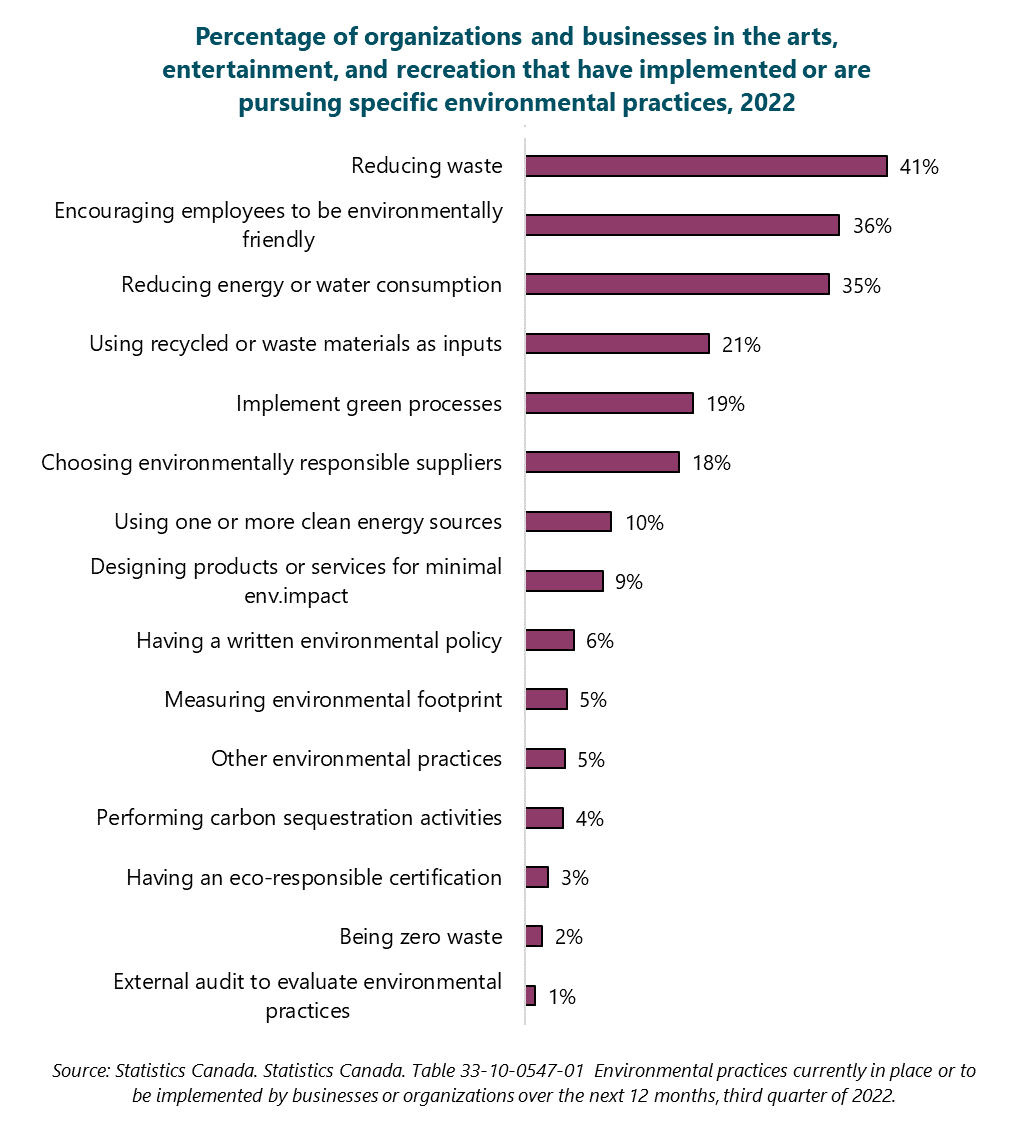
[15 different options were given, from “reducing waste” to “obtaining or maintaining one or more eco-responsible certifications”. The full list is provided in the first graph.]
Note: Arts, heritage, and entertainment (which the survey refers to as “arts, entertainment, and recreation”) includes performing arts, spectator sports, and related industries (industry code 711); heritage institutions (code 712); amusement, gambling, and recreation industries (code 713).
Environmental practices in the arts, heritage, and entertainment in Canada
Two-thirds of arts, heritage, and entertainment organizations and businesses have some type of environmental practice or policy (66%), a percentage that is higher than the average for all Canadian organizations and businesses (58%) but similar to that for all not-for-profit organizations (68%).
Note that the percentages in this post are high-end estimates, because they include organizations that “plan to implement [an environmental practice] over the next 12 months”, as well as organizations that have already pursued the practice. Unfortunately, Statistics Canada did not ask a version of the question for just those who have already implemented specific practices.
As shown in the graph below, common environmental practices among organizations and businesses in the arts, heritage, and entertainment include reducing waste (41%), encouraging employees to adopt environmentally friendly practices (36%), and reducing energy or water consumption (35%). For all three of these practices, the arts, heritage, and entertainment are above the average for all Canadian organizations and businesses (35%, 28%, and 24%, respectively).
On the other hand:
94% of organizations and businesses in the arts, heritage, and entertainment do not have a written environmental policy.
95% do not measure their environmental footprint.
97% have not obtained or maintained one or more eco-responsible certifications.
These percentages are similar to the averages for all Canadian organizations and businesses.
Data quality indicators: Very good (B rating) for reducing waste; encouraging employees to be environmentally friendly; reducing energy or water consumption; and using recycled or waste materials as inputs. Excellent (A) for all other practices.
Barriers to adopting more environmental practices
Money is a significant factor for organizations and businesses in the arts, heritage, and entertainment. When asked about potential barriers to adopting more green practices over the next 12 months, a lack of financial resources was the most common barrier, but this was only selected by about one-third of respondents:
35% of organizations or businesses in the arts, heritage, and entertainment say that they lack financial resources.
29% perceive time constraints or labour limitations.
27% say that “clients are not willing to pay a higher price”.
Source: Statistics Canada. Table 33-10-0548-01 Barriers businesses or organizations face in adopting more green practices over the next 12 months, third quarter of 2022. Data quality rated as very good or excellent. Respondents could select multiple options.
Environmental practices in the arts, heritage, and entertainment in each province
British Columbia (75%), PEI (75%), and Quebec (73%) have the highest proportion of organizations or businesses in the arts, heritage, and entertainment that have pursued (or will soon pursue) some type of environmental practice, as shown in the graph below. (The full list of environmental practices is in the Canadian graph above.) Alberta, Ontario, and New Brunswick (each 59%) have the lowest proportion of organizations or businesses in the arts, heritage, and entertainment that have pursued (or will soon pursue) some type of environmental practice.
Data quality indicators: Canada: very good (B). Each province: good (C).
Written environmental policies in the arts, heritage, and entertainment in each province
Across the country, there are substantial differences in the (relatively small) proportion of organizations and businesses in the arts, entertainment, and recreation that have implemented or are pursuing a written environmental policy. The proportion is highest in Quebec and Nova Scotia (both 10%) and lowest in Ontario (2%) and Saskatchewan (3%). The graph below provides details for each province.
Data quality indicators: Excellent (A) for Canada, British Columbia, Saskatchewan, Ontario, and New Brunswick. Very good (B) for Alberta, Manitoba, Quebec, Nova Scotia, Prince Edward Island, and Newfoundland and Labrador.


Thx!