How much do urban and rural residents spend on the arts, culture, and heritage?
The final part of my series on the demographics of consumer spending in Canada in 2023

Today’s article examines household spending on the arts, culture, and heritage by population size, as well as some other spending items for context. This is my last article on consumer spending in Canada in 2023. Today’s article is also my last one this calendar year, and I wish you joy and peace this holiday season.
As was the case with my other demographic articles (covering spending by income and age), I’ll compare spending by households residing in areas of different population sizes with benchmark averages from an earlier article on household spending: $531 per household on artworks and arts participation items, representing 0.7% of household spending (after taxes, pension contributions, and gifts are excluded), as well as $1,623 per household on cultural goods and services, representing 2.1% of household spending. For context, I’ll also analyze overall household spending and spending on cars.
The data by population size cover a spectrum of areas in which survey respondents live, including population centres of (a) 1,000,000 residents and over, (b) 500,000 to 999,999, (c) 250,000 to 499,999, (d) 100,000 to 249,999, (e) 30,000 to 99,999, and (f) 1,000 to 29,999. Only areas with a density of 400 or more people per square kilometre are considered “population centres”. Respondents in areas with fewer than 1,000 residents and/or a population density below 400 people per square km are classified as rural.
The article offers two main indicators: dollars spent per household and percentage of household spending. The strength of the percentage estimates is that they place the spending levels in the context of how much money each group of Canadians has to spend.
My category of “artworks and arts participation” includes six items: 1) works of art, carvings, and other decorative ware; 2) books; 3) tickets to live performances; 4) movie tickets; 5) admissions to museums, zoos, and other heritage sites; and 6) art and craft materials. The 19 cultural goods and services include these six items, plus 13 others, all of which are listed at the end of this article. Spending details for individual items that are included in arts spending and cultural spending are not provided in today’s article, due to space and time limitations.
Given the limitations of Statistics Canada’s Survey of Household Spending, I would consider the analysis to be a limited but reasonable approximation of consumer spending on the arts. I would consider the broader estimate of spending on culture (including the arts, culture, and heritage) to be a less-limited approximation, but still imperfect. My categories only include those spending items that are available in the dataset, not everything that one might want to include in arts spending or cultural spending. More details on the survey’s methods and limitations are in the notes at the end of the article.
Context: differences in overall consumption and spending on cars by population size
The first graph shows average spending per household on everything. Average consumer spending tends to increase with population size, from an average of $63,000 in rural areas to $83,900 in large cities with at least 1 million residents.

For further context, I’ll examine spending differences on cars. The next graph shows that average spending on vehicles does not have a distinct pattern by population size.

There is no distinct pattern in the final context graph either. As a percentage of total household spending, vehicle purchases are above the national average (5.4%) among rural Canadians (6.0%), residents in cities with 100,000 to 249,999 residents (7.1%), and cities with 500,000 to 999,999 residents (7.3%).

Spending on the arts, culture, and heritage by population size
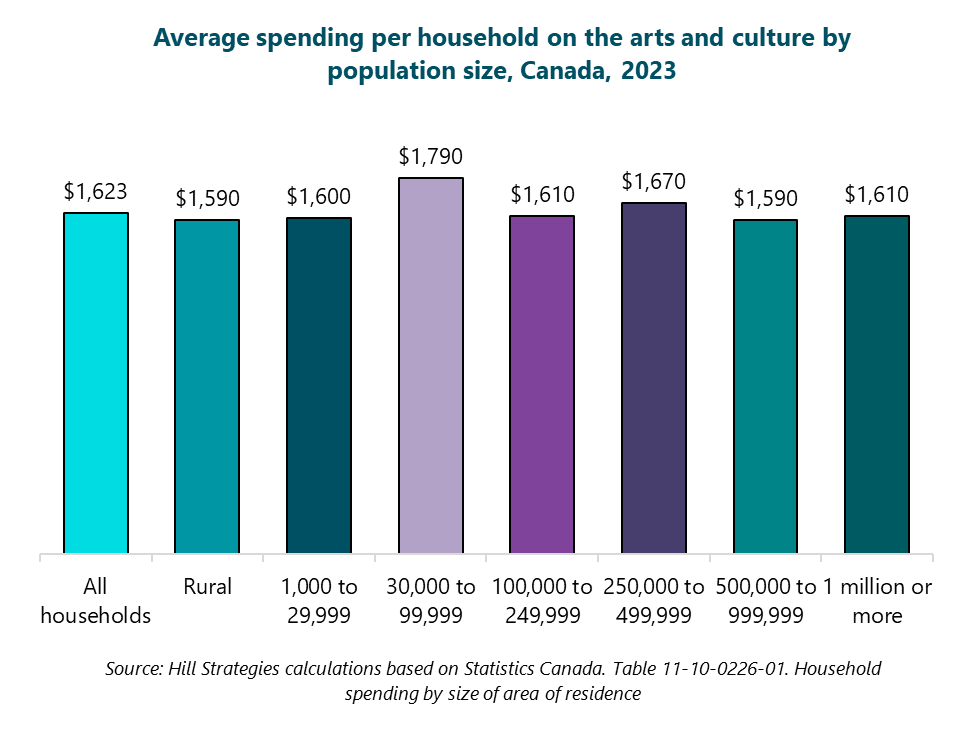
Similar spending on the arts, culture, and heritage in dollar terms
Average cultural spending is very close to the national average ($1,623 per household) in all but one population size group, the exception being residents of areas with populations between 30,000 and 99,999, who spend an above-average amount ($1,790).