
Are the arts elitist?
Part 1: Income analysis, using data on consumer spending in 2023

Here’s a theme that has run through the background of my 29-or-so years of arts research: Are the arts elitist?
I’ll examine this question using data on consumer spending on the arts, culture, and heritage in Canada in 2023. More specifically, I’ll look at three possible elements of “elitism”: income (this week’s article), age (a subsequent article), and urban / rural residence (later still).
Today I’ll analyze how much is spent on the arts and culture by households in different income ranges. I’ll compare their spending with benchmark averages from a previous article: $531 per household on artworks and arts participation items, representing 0.7% of consumer spending (after taxes, pension contributions, and gifts are excluded), as well as $1,623 per household on cultural goods and services, representing 2.1% of consumer spending.
I’ll also analyze data related to another age-old question: are cars elitist?
Each of the two sets of indicators in this article ($ spent per household and % of household spending) tells us something. If I had to rely on just one, I’d probably choose the spending percentage, simply because it places the spending levels in the context of how much money each group of Canadians has to spend.
My category of “artworks and arts participation” includes six items: 1) works of art, carvings, and other decorative ware; 2) books; 3) tickets to live performances; 4) movie tickets; 5) admissions to museums, zoos, and other heritage sites; and 6) art and craft materials. The 19 cultural goods and services include these six items, plus 13 others, all of which are listed at the end of this article. Spending details for individual items that are included in arts spending and cultural spending are not provided in today’s article, due to space and time limitations.
Given the limitations of Statistics Canada’s Survey of Household Spending, I would consider the analysis to be a limited but reasonable approximation of consumer spending on the arts. I would consider the broader estimate of spending on culture (including the arts, culture, and heritage) to be a less-limited approximation, but still imperfect. My categories only include those spending items that are available in the dataset, not everything that one might want to include in arts spending or cultural spending. More details on the survey’s methods and limitations are at the notes at the end of the article.
Data correction from last week’s article
Before digging into the new analysis, I need to issue a correction to one element of last week’s article. Spending on culture in Canada was $1,623 in 2023, not $1,846 as noted in the trend analysis in the article. The article has been updated with the following paragraph, and the accompanying graph has also been updated.
CORRECTION: The broader category of consumer spending (arts, culture, and heritage) changed very little between 2019 ($1,659 per household) and 2023 ($1,623). The estimate was slightly higher in 2021 ($1,703).
No other data needed correcting (e.g., spending on artworks and arts participation, or spending as a percentage of overall household spending).
Context: differences in overall consumption and spending on cars by household income group
I’m using the term “income group” to describe what Statistics Canada calls “income quintiles”. Quintiles are equally sized groups of households along the spectrum of household income. Each group contains as close as possible to 20% of households. For example, the lowest income group contains the 20% of households with the lowest household incomes. (The dataset doesn’t provide the income ranges for these quintiles, but the first graph below shows average spending for each quintile.)
Before examining spending on the arts and culture, here is a graph of average spending per household on everything (except for taxes, pension contributions, and gifts). The highest income households in Canada spend three times as much as the lowest income households (over $123,000 vs. roughly $40,000).

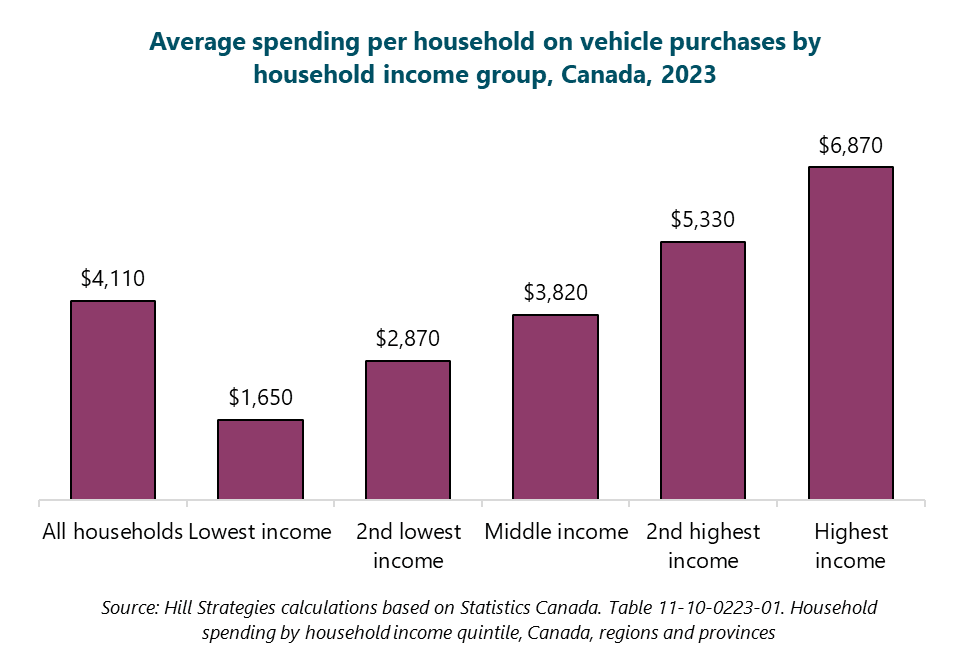
Are cars elitist?
For further context, I’ll examine spending on cars by income group to examine whether cars could be considered an elitist item. The following graph shows that the highest income households spend roughly four times more per year on vehicle purchases than the lowest income households (average spending of $6,870 and $1,650).
My final context graph examines spending on cars as a percentage of total household spending. This is the second key indicator examined throughout this article: percentage of consumer spending on specific goods and services. The graph shows that households in the top two income groups allocate more of their overall spending to cars than households in lower income groups.

Spending on the arts, culture, and heritage by income group
Cultural spending, in dollar terms, increases with income
As shown in the following graph, consumer spending on the arts, culture, and heritage clearly increases with income. The highest income group spends more than double, on average, than the lowest income group ($2,420 vs. $1,050).

As a percentage of total spending, cultural spending is highest for the lowest income group
The second graph shows that, as a percentage of overall household spending, it is actually the lowest income group that spends much more on the arts, culture, and heritage (2.6% of household budgets) than any other income group (2.0% to 2.2%).
