

This article highlights statistics on Indigenous and racialized artists, cultural workers, and arts leaders in British Columbia, using custom data that Hill Strategies requested from Statistics Canada’s 2021 long-form census.
The article was prepared with the support of the British Columbia Arts Council and the Ministry of Tourism, Arts, Culture and Sport. Hill Strategies retained analytical independence and editorial control of the content.

In the census, Indigenous identity is based on self-identification as First Nations, Métis, and/or Inuit. In this article, I generally use the term racialized to refer to what Statistics Canada has called the visible minority population. For brevity, the article sometimes uses the acronym BIPOC (black, Indigenous, people of colour) to refer to the combination of Indigenous and racialized workers in the province.
Important notes regarding census questions and occupational categories are provided at the end of this article.
Number of Indigenous and racialized workers in the arts, culture, and heritage in British Columbia
A previous article in the Statistical insights on the arts series identified 39,700 artists in British Columbia, representing 1.4% of the 2.9 million people in the province’s overall labour force. B.C. has the highest proportion of artists in its labour force among the provinces.
Similarly, the article found that there are 154,800 workers in arts, culture, and heritage occupations residing in B.C., or 5.4% of the provincial labour force, also the highest proportion among the provinces.
Just over 10,000 British Columbians work in five occupation groups that are classified as arts leaders.
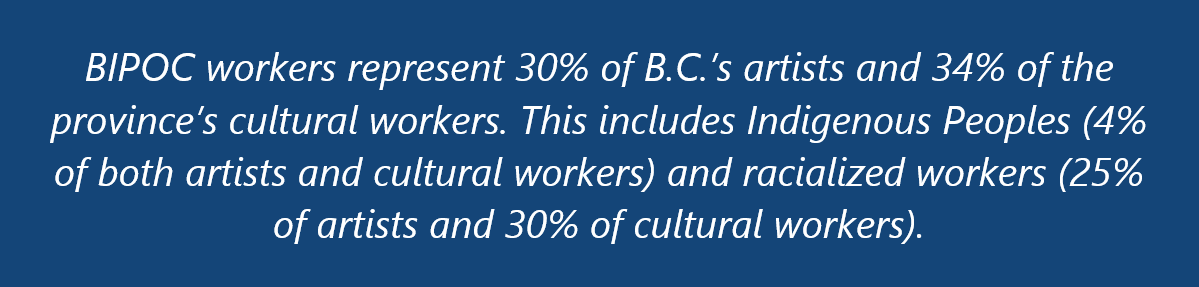
Among the 39,700 artists in B.C., 11,800 are BIPOC (30% of the province’s artists), including 1,800 Indigenous artists (4%) and 10,000 racialized artists (25%).
Of the province’s 154,800 cultural workers, 52,100 are BIPOC (34% of cultural workers), including 5,800 Indigenous cultural workers (4%) and 46,300 racialized cultural workers (30%).
Of the province’s 10,100 arts leaders, 2,500 are BIPOC (25% of arts leaders), including 340 Indigenous cultural workers (3%) and 2,200 racialized cultural workers (21%).
In the provincial labour force as a whole, 1.1 million workers are BIPOC (40%), including 148,200 Indigenous workers (5%) and 994,400 racialized workers (35%).
No British Columbia artists, cultural workers, or arts leaders indicated on the census that they are both Indigenous and racialized.
Representation of BIPOC people is lower in the arts, culture, and heritage than in the overall workforce
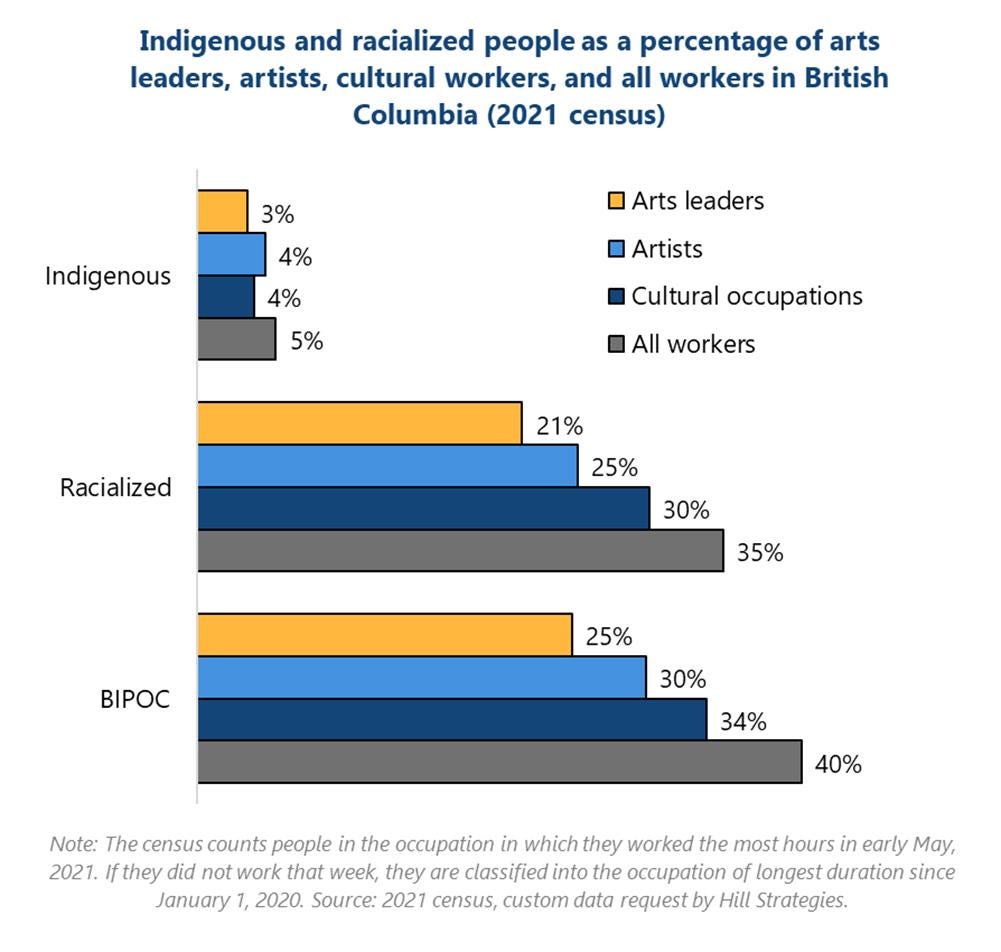
The following graph compares the proportion of artists, all cultural workers, arts leaders, and all workers in B.C. who are Indigenous or racialized.
The representation of BIPOC workers is highest in the province’s overall workforce, followed by the broad cultural workforce, with lower representation of BIPOC people as artists and (especially) arts leaders.
For example, Indigenous Peoples represent 5% of the province’s labour force, 4% of workers in cultural occupations, 4% of artists, and 3% of arts leaders. Racialized workers represent 35% of the province’s labour force, 30% of workers in cultural occupations, 25% of artists, and 21% of arts leaders.
Incomes of BIPOC artists, cultural workers, and arts leaders
Median personal income was chosen as the key financial indicator for this article. Personal income refers to all sources of an individual’s income. Median incomes provide a better indication of the situation of a typical worker than the average (i.e., the “mean”), which is more strongly affected by a few individuals with very high incomes.
The article examines income statistics for artists, arts leaders, and cultural workers as groups – not for individual occupation categories (e.g., writers, actors, performing arts managers, etc.). It should be kept in mind that the income statistics from the 2021 census relate to the 2020 calendar year, which included significant slowdowns in artistic activity.
Incomes of BIPOC artists
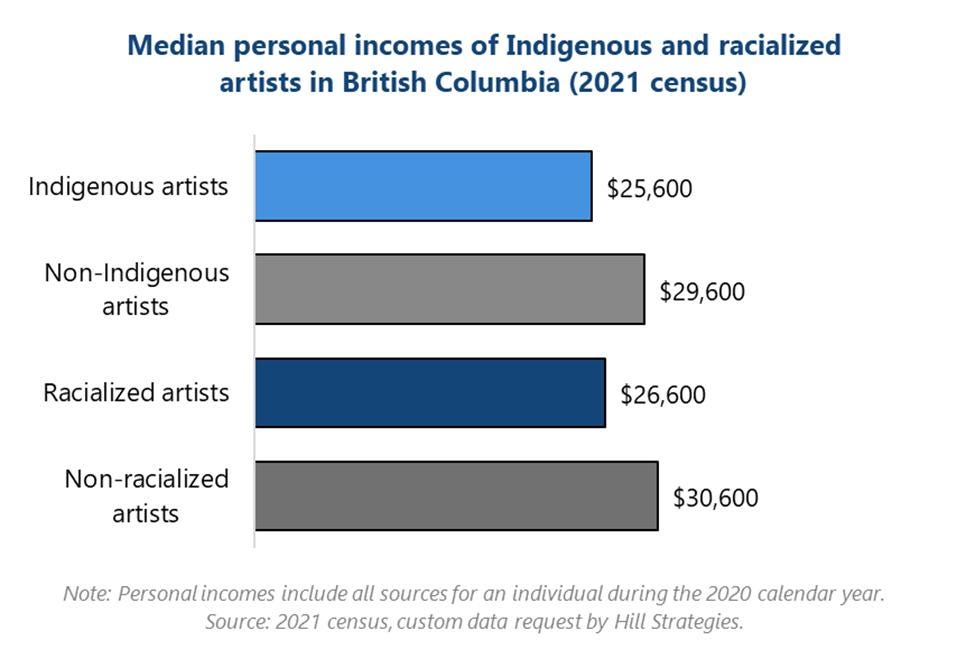
Whether they are Indigenous or racialized, the median incomes of BIPOC artists are lower than for other artists in British Columbia, as shown in the following graph.
The median personal income of Indigenous artists (from all sources) was $25,600 in 2020, 14% lower than the median for non-Indigenous artists ($29,600).
The median personal income of B.C.’s racialized artists was $26,600 in 2020, 13% lower than the median for non-racialized artists ($30,600).
Incomes of BIPOC cultural workers
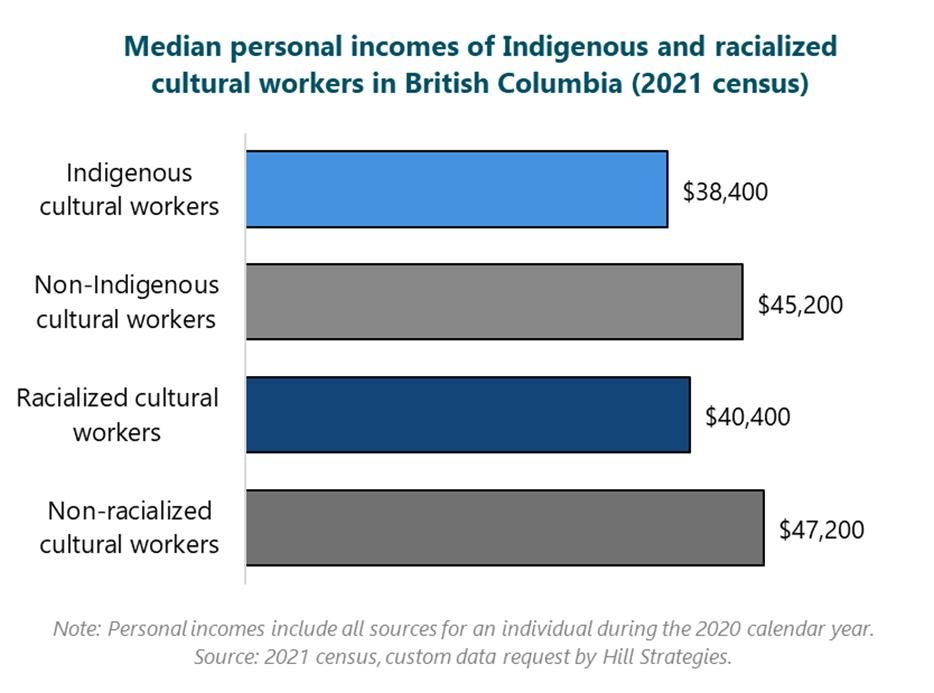
Among cultural workers in British Columbia, Indigenous Peoples have a median income that is 15% lower than non-Indigenous cultural workers ($38,400 vs. $45,200, as shown at the top of the following graph).
For racialized cultural workers, the median income ($40,400) is 14% lower than for non-racialized cultural workers ($47,200).
Incomes of BIPOC arts leaders
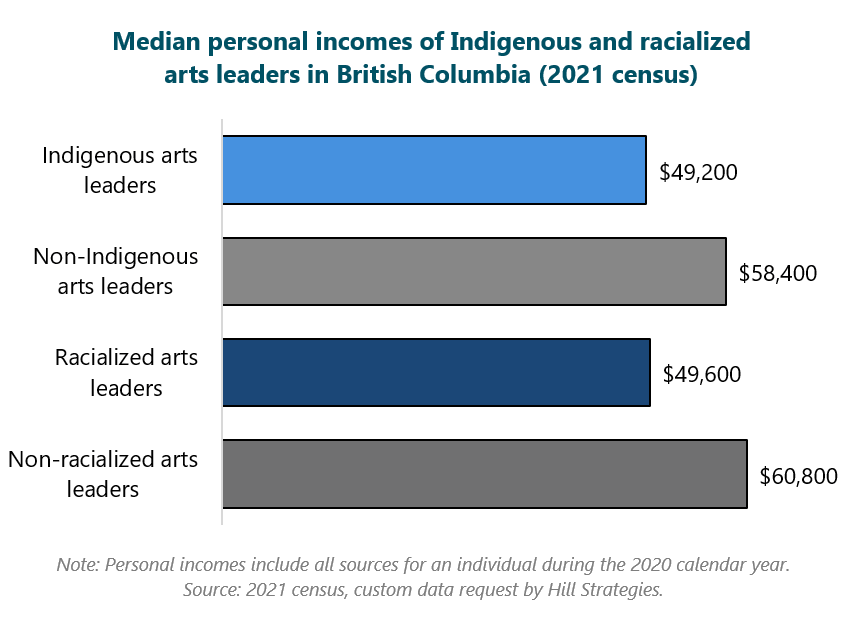
Among people with high level arts occupations in British Columbia, Indigenous Peoples have a median income that is 16% lower than non-Indigenous workers ($49,200 vs. $58,400, as shown at the top of the following graph).
For racialized arts leaders, the median income ($49,600) is 18% lower than for non-racialized arts leaders ($60,800).
Notes on census methods and occupation groupings
Statistics Canada indicates that, in the census, “Indigenous identity refers to whether the person identified with the Indigenous peoples of Canada. This includes those who identify as First Nations (North American Indian), Métis and/or Inuk (Inuit), and/or those who report being Registered or Treaty Indians (that is, registered under the Indian Act of Canada), and/or those who have membership in a First Nation or Indian band.”
There is a great diversity of Indigenous Peoples residing on the territory commonly known as British Columbia. However, for the purposes of this focus on artists – a relatively small population group – it has been necessary to examine Indigenous Peoples as one group.
Readers should be aware that Census data are less complete for Indigenous Peoples than many other groups, which might result in a low estimate of the number of Indigenous artists, cultural workers, and other workers. However, this may be less of an issue in urban areas than on reserves. Some reserves and settlements did not allow census activity within their borders, while other areas were inaccessible due to wildfires or floods in the spring of 2021. Statistics Canada estimates that 20% of the on-reserve Indigenous population in B.C. did not respond to the long-form census, a non-response rate that is many times higher than for the general population (2.9%). The response rate was likely higher for Indigenous residents off-reserve than on-reserve.
According to Canada’s Employment Equity Act, visible minority people include “persons, other than Aboriginal peoples, who are non-Caucasian in race or non-white in colour.” Census respondents, including members of their household, were classified as racialized or not mainly based on their response to the question “Is this person:”, followed by 11 response options containing the most common population groups as well as an area for a brief open-ended response. The 11 readily available options were: White, South Asian (e.g., East Indian, Pakistani, Sri Lankan), Chinese, Black, Filipino, Arab, Latin American, Southeast Asian (e.g., Vietnamese, Cambodian, Laotian, Thai), West Asian (e.g., Iranian, Afghan), Korean, and Japanese. Respondents could select multiple options for each person in their household. Respondents selecting any option except for White were counted as racialized people, as were some respondents who wrote in their response.
The analysis relates to professional workers, but with a very specific concept of professional. Census data on occupations include people who worked more hours as an artist than at any other occupation between May 1 and 8, 2021, plus people who were not in the labour force at that time but had worked more as an artist than at another occupation between January of 2020 and May of 2021. Part-time artists who spent more time at another occupation in May of 2021 would be classified in the other occupation. (The same would be true of workers in all cultural occupations.)
The occupational perspective in this article counts people who work across the economy, as long as they are classified into one of 10 artist occupation groups, 52 cultural occupation groups, or 5 arts leader occupation groups. Details about the occupation groups included in these categories is available in another article in the Statistical insights on the arts series, which also outlined the methods behind choosing the 52 cultural occupation groups. A separate article highlighted some strengths and limitations of the census for counting artists and cultural workers. To ensure confidentiality and data reliability, no estimates of fewer than 40 people are presented in this article.
The challenging context of the pandemic in 2020 and 2021 is important to keep in mind when interpreting census data on artists, which were collected in May of 2021. Income data from the census relate to the 2020 calendar year.