
The City of Toronto accounts for an increasing proportion of artists in Ontario and Canada, but incomes remain low
Double the number of professional artists in the Toronto area between 1991 and 2021

Today’s article provides a careful analysis of statistics on the number of artists in the City of Toronto and the Toronto Census Metropolitan Area from 1991 to 2021. This article was made possible through a Toronto Arts Council subscription to the Statistical insights on the arts series.
In keeping with Hill Strategies’ other work from the 2021 census, including a statistical profile of artists in Toronto in 2021 (available here), 10 specific occupation groups are included as “artists”:
Actors, comedians, and circus performers
Artisans and craftspersons
Authors and writers (excluding technical writers)
Conductors, composers, and arrangers
Dancers
Musicians and singers
Other performers
Painters, sculptors, and other visual artists
Photographers
Producers, directors, choreographers, and related occupations
Further notes about methods are included at the end of this article.
Toronto’s proportions of all artists in Ontario and Canada have increased slightly
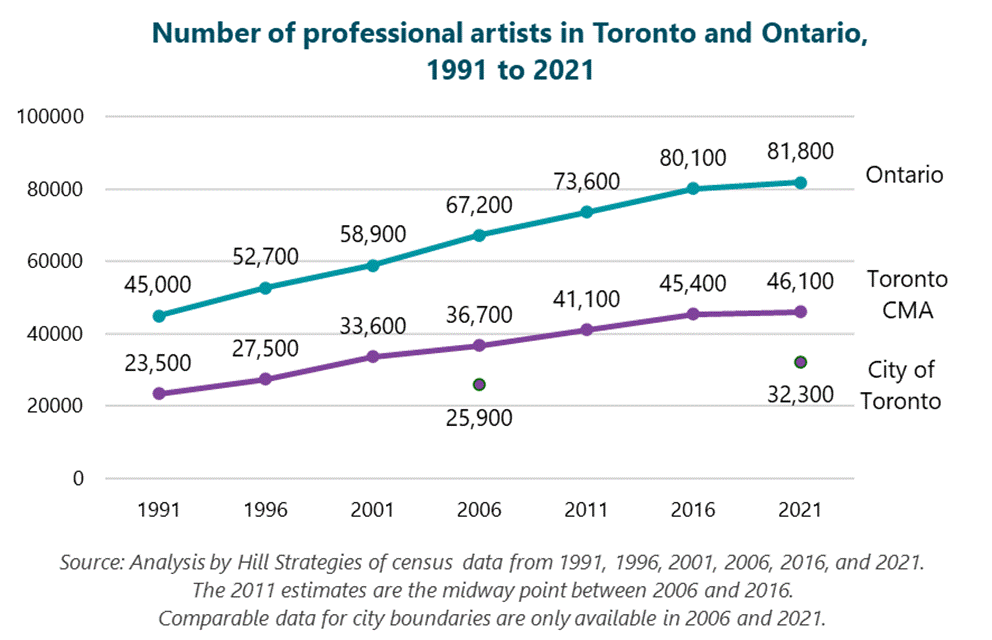
In 2021, there were 32,300 professional artists residing in the City of Toronto, which is a 25% increase over the number in 2006 (25,900). This growth rate is slightly higher than the 22% increase in Ontario and the 23% increase in all of Canada.
Toronto represents a slightly increasing proportion of professional artists in the province and the country. As a percentage of all artists in Ontario, artists in the City of Toronto accounted for 38.6% in 2006 and 39.5% in 2021 (or. As a percentage of all artists in Canada, artists in the City of Toronto represented 15.7% in 2006 and 15.9% in 2021.
Toronto is home to roughly 1 in every 2.5 artists in Ontario and 1 in every 6.3 artists in Canada.
The following sections focus on the number of artists Toronto Census Metropolitan Area (CMA), because we have more comparable data points for CMAs than municipalities. The notes at the end of this article explain why comparable data are not available for the City of Toronto for other census years.
In 2021 (the most recent year), artists in the City of Toronto represented 70% of artists in the Toronto CMA. This proportion has barely changed since 2006 (70.6% to 70.1%). The 25% increase in the city between 2006 and 2021 is equal to the increase in the Toronto CMA during the same timeframe. These similarities indicate that trends in the City of Toronto and the Toronto CMA have likely been similar over time.
Twice as many artists in the Toronto CMA in 2021 as in 1991
In 2021, there were 46,100 professional artists in the Toronto CMA, compared with 23,500 in 1991. This represents an increase of 96% in the number of professional artists in the CMA over a 30-year timeframe, which is double the 48% increase in the overall labour force in the Toronto CMA. The increase in artists in the Toronto CMA is higher than the provincial increase (82%) and the nationwide increase (75%).
The following graph demonstrates that, since 1991, there have been strong increases in the number of artists in the Toronto CMA and in the province of Ontario. In addition, the two data points for the City of Toronto (2006 and 2021) are also shown in the graph. The number of artists in the City of Toronto grew at the same rate (25%) as in the Toronto CMA between 2006 and 2021.
Growth in all six periods in the Toronto CMA, but the growth rate has slowed
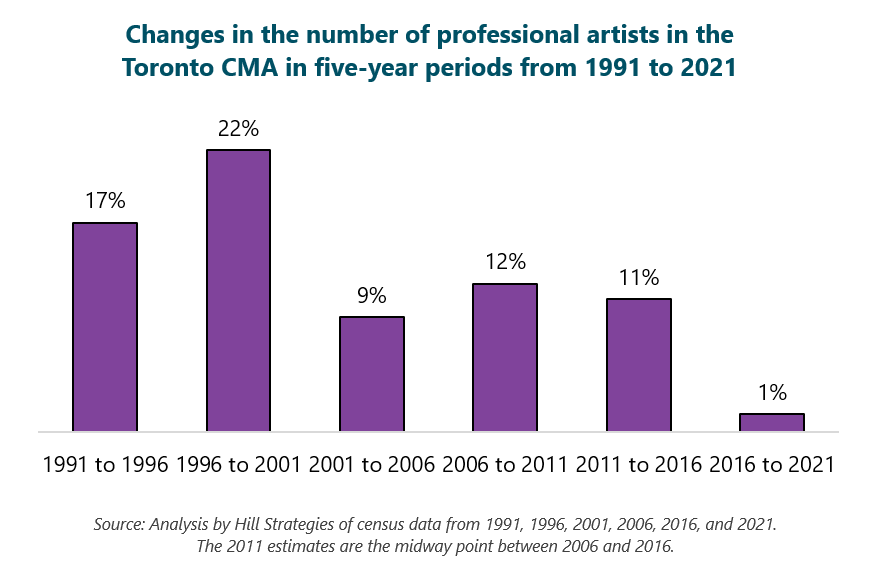
The following graph shows that, in the Toronto CMA, there has been an increase in the number of artists in all six five-year periods between 1991 and 2021. The largest increases came early on: 17% between 1991 and 1996 and 22% between 1996 and 2001. In the most recent five-year period (2016 to 2021), the number of professional artists in the Toronto CMA grew by just 1%.
Note regarding 2011 data: Because of significant changes in methods of the (voluntary) National Household Survey in 2011, I do not consider the count of artists in that year to be comparable to other years. For graphing purposes, I have imputed estimates for 2011 as the midpoints between the 2006 and 2016 estimates.
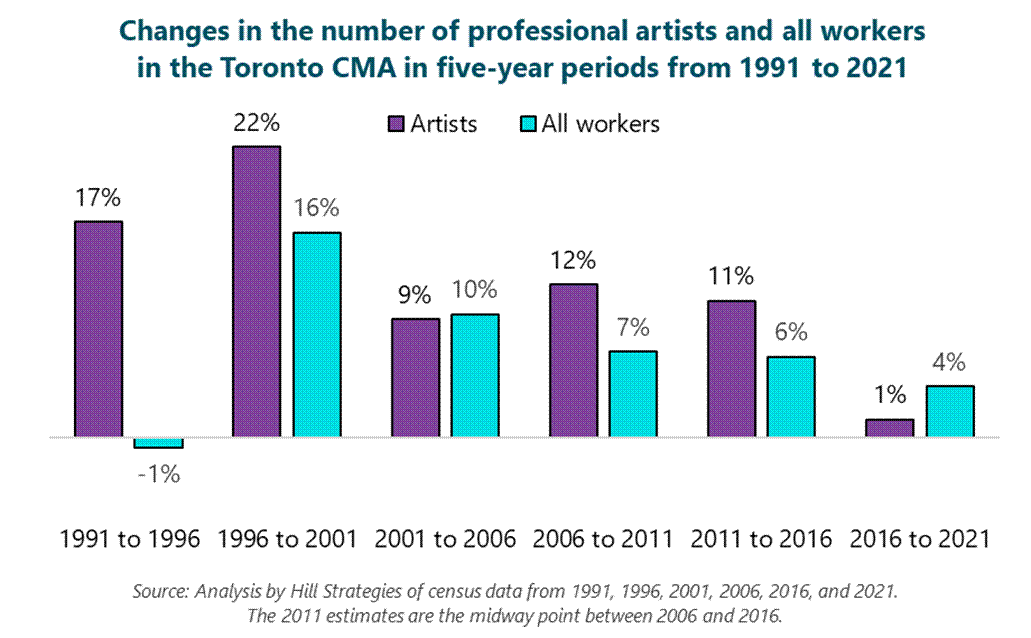
The increase in the number of artists in the Toronto CMA has been higher than the increase in the overall number of workers in most periods, as shown in the following graph. The largest exception is the most recent period (2016 to 2021), where the 4% increase in all workers in the Toronto CMA exceeded the 1% increase in the number of artists.
Strong growth in the number of artists in the City of Toronto since 1991, according to two rough estimates
The proportion of artists in the Toronto CMA residing in the City of Toronto changed very little over the time period for which we have data for both geographies (i.e., 70.6% in 2006 and 70.1% in 2021).
The limited change in this proportion allows for a rough estimate of 16,600 artists in the City of Toronto in 1991. This estimate assumes that the City of Toronto’s proportion of artists in the CMA (based on the city’s current boundaries) was the same in 1991 as it was in 2006 (70.6%). Under this assumption, the growth in the number of artists in the City of Toronto would have been 94% between 1991 and 2021 (nearly double, roughly equal to the change in the CMA).
A second estimate is based on data in Hill Strategies’ historical reports, which used slightly different methods than the most recent data year (i.e., including only those artists with employment or self-employment income and nine artist occupation groups, excluding photographers). The historical reports showed that artists in the City of Toronto represented 76% of all artists in the Toronto CMA in 1991. Using this higher estimate of the proportion of artists in the CMA in 1991, there would have been 17,900 artists in Toronto in 1991. The growth in the number of artists would have been 81% (from 17,900 in 1991 to 32,300 in 2021), still a very high growth rate.
Average employment income of Toronto artists has not kept up with inflation
As noted above, there is roughly comparable data on artists in the City of Toronto in 2006 and 2021. Data on average employment income was requested for both years. The income data relate to the preceding years, i.e., 2005 and 2020.
Because of the changes in the artist occupation groups between 2005 (9 occupation groups, excluding photographers) and 2020 (10 occupation groups, including photographers), it is easier to estimate the average income of artists in 2005, including an adjustment for photographers, than the median income, which is the most common income statistic in other Hill Strategies articles.
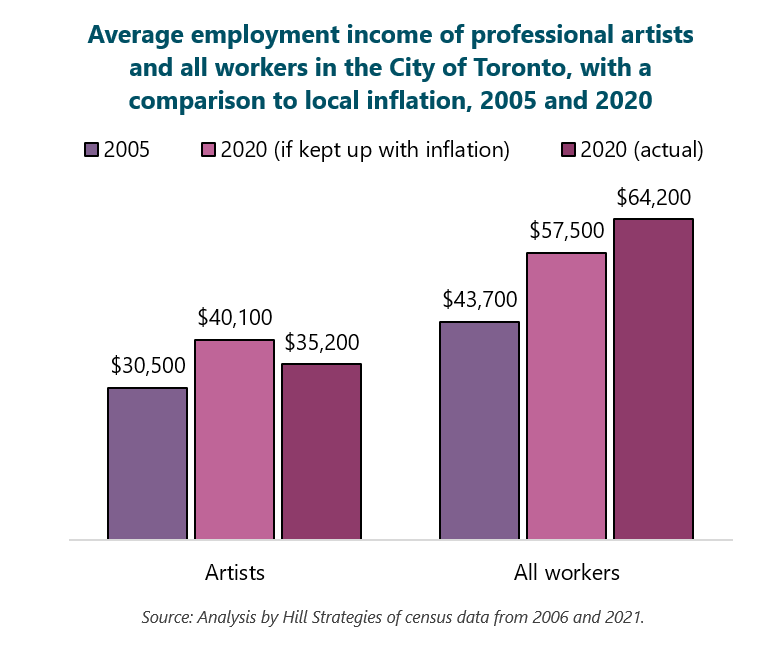
In 2020 (the most recent data year), the average income of Toronto’s artists from employment and self-employment was $35,200, which is 45% below that of all Toronto workers ($64,200). However, the average employment income of Toronto artists was above the average for all Ontario artists ($28,200).
In 2005, the average income of Toronto’s artists from employment and self-employment was $30,500, or 30% less than all Toronto workers ($64,200). The average employment income of local artists was above the average for all of Ontario in 2005 ($28,200).
The above statistics show that the income gap between artists and other workers in Toronto has grown over time, from 30% in 2005 to 45% in 2020.
In addition, the average employment income of artists in Toronto did not keep pace with inflation. The average employment income of artists increased from $30,500 in 2005 to $35,200. This 16% increase is about one-half of the 31% increase in the Consumer Price Index in Toronto during this period. If the employment income of Toronto artists had simply kept up with inflation, the average income would have been roughly $5,000 higher in 2021 ($40,100 rather than $35,200).
The average employment income of all Toronto workers grew by 47% between 2005 and 2020, higher than the 31% local inflation rate.
The final graph in today’s article highlights the income changes in the City of Toronto between 2005 and 2020.
Notes and methods
More data are available for the Census Metropolitan Area, despite significant research efforts
I have spent many days seeking out comparable data on the number of artists from different census periods, scouring hundreds of datasets from five census years (1991, 1996, 2001, 2006, and 2016) to find data that are comparable to my custom data request in 2021. I downloaded promising datasets, pinpointed the 10 artist occupations (out of about 700 occupational categories), copied the artist data into spreadsheets, and analyzed the results.
For municipalities, I was unable to find comparable data for the entire period. However, I was able to find data for:
the City of Toronto for 2006 and 2021
the Toronto Census Metropolitan Area (CMA) for 1991 through 2021
the Province of Ontario for 1991 through 2021
Here are the details of what I needed to address to ensure an “apples-to-apples” comparison of artists over time.
Changes in our definition of artists
In 2021, in consultation with readers, we decided to include photographers as an artist occupation. Photographers had not been included in my previous counts of artists or the data that I had requested in previous census years. I have adjusted my estimates of the number of artists in previous census years to include photographers (which is an occupation group that was included separately in my data requests).
I have also adjusted my estimates of the average employment income of artists in 2005 to include photographers. The initial estimate in Toronto in 2005 ($30,700) was revised downward by $200 to account for the lower employment incomes of photographers ($26,900). The adjustment was weighted to reflect photographers’ share of all artists in Toronto in 2006 (7%).
Periodic changes in Statistics Canada’s occupational classifications
For artists, almost all the classification changes have been between occupation groups that are both included as artists, rather than between artist and non-artist occupation groups. That is good! However, because of the changes, an analysis of trends is not possible for many individual artist occupations.
A new occupation group was created in 2021 for “technical writers”. The 100 Toronto workers in this occupation group were not counted as artists in 2021 but were included with other types of writers (an artist occupation group) in every other census year since 1991. To adjust for this, the counts of artists prior to 2021 have been reduced by 3%, which is the proportion of technical workers among all artists and technical writers in 2021. An adjustment was not made to historical estimates of employment income, because no historical information is available for technical writers.
Slightly different definitions of who is counted as a worker (including artists) in different datasets
This is a tricky challenge and one that even holds for a single census year. Some datasets exclude people who were out of the labour force in May but had worked at some point in the previous 16 months. Many other datasets only include those who were in the labour force at the time in May of each census year.
My analyses of 2021 census data have included all people classified into an occupation, even though some of them did not work in May of 2021.
I believe that this inclusion is particularly helpful when looking at the number of professional artists, because of the ebbs and flows of artistic work.
I had to find datasets from each census year based on the same type of count (called “universe” by Statistics Canada). This was one of the toughest challenges.
Changes to census methods
The 2011 census was an outlier year, because the equivalent of the long-form census (called the “National Household Survey”) was a voluntary survey of 30% of all households. In all other census periods, the long-form census was a mandatory survey that covered 20% of households from 1991 to 2006 and 25% of households in 2016 and 2021.
The response rate in 2011 was just 69%, compared with a typical response rate above 95% in other years. I do not believe that the 2011 data are comparable to other years – and, indeed, the 2011 data tend to be quite different from other census periods.
Because of the lack of comparable data for 2011, I have imputed data for that year as the midpoint between the estimates for 2006 and 2016. The percentage changes are therefore imprecise for 2006 to 2011 and 2011 to 2016 but do provide an accurate portrait of the changes during the broader timeframe (i.e., 2006 to 2016).
Limitations of the analysis
There are some elements that I have not been able to address:
Change in the number of cultural workers, because there have been significant changes in some of the 52 occupation groups that are included as cultural workers
Demographic breakdowns, because of additional complications due to the relative lack of readily available, comparable census data
For those who are particularly curious, I’ve written about some of the census changes in more detail, especially here, here, and here. My article on changes in the number of artists in Ontario is here.
Other notes
Here are some other important notes to keep in mind when considering the above analysis of artists in the workforce:
The analysis relates to professional workers, but with a very specific concept of professional. The census data on occupations include people who worked more hours as an artist than at any other occupation during the census week (always in early May), plus people who were not in the labour force at that time but had worked more as an artist than at another occupation after January 1 of the prior year (2020, in the case of the 2021 census). Part-time artists who spent more time at another occupation during the census period would be classified in the other occupation.
The atypical nature of artists’ workflows can make it challenging for official statistics to count artists as artists. As such, census estimates of the number of artists might be low. “Gig work” has been common among artists for a very long time. Internet sources even indicate that the term “gig” was coined by jazz musicians in the early 1900s. (Source examples here and here.)