Are there more professional artists in Canada now than 30 years ago?
How do the changes in census counts compare to the overall labour force?
Careful readers of Statistical insights on the arts may have noticed that I have stated that my statistics on artists from the 2021 census are not directly comparable to other census years, even counts that I myself published from those years. (I’ve been doing them since the 2001 census.)
I have stated that I would “eventually work out appropriate comparisons to previous census years”. That eventuality is today – for Canada-wide data, at least.
Sponsors: I’d like to know if you are interested in an historical article as your custom post this year. As noted below, I have additional challenges at the municipal level, but I am starting to investigate the options now. (So far, it looks like data for Census Metropolitan Areas are easier to find than local municipalities.)
If you are not yet a sponsor but are interested in an historical analysis, please sign up below and choose the “Sponsor-shareable” option. I’ll be in touch when I get a notification of the sign-up.
Everyone else: Please consider a paid subscription to help support this work and ensure its longevity. It’s certainly not profitable yet!
Thanks, Kelly
Complications
I have figured out an analysis of changes over time, comparing apples to apples. I should note that working through these issues regarding the number of artists is the relatively easy part. Working through data issues regarding artists’ incomes is even more challenging.
Today’s post covers changes in the number of artists, not changes in their incomes.
Here’s a brief list of what I needed to address:
Changes in our definition of “artists”, specifically the inclusion of photographers in 2021. (They were excluded from my previous counts of artists.)
Changes in Statistics Canada’s occupation groupings. Most (but not all) of the changes have been between occupation groups that are both included as artists, rather than between artist and non-artist occupation groups. Plus, there is the new wrinkle of a separate occupation group for “technical writers” (not considered artists) in 2021.
Slightly different definitions of who is counted as a worker (including artists) in different datasets. This challenge even holds for one census year, where some datasets exclude people who were either unemployed or out of the labour force in May but had worked at some point in the previous 16 months. Most of my analyses so far have included those workers, despite their non-working status in May of 2021.
Changes in census methods, particularly the outlier year of 2011, when the National Household Survey was a voluntary survey of 30% of all households, rather than the mandatory long form census of 20% of households (through 2006) or 25% of households (2016 and 2021). The response rate in 2011 was just 69%, compared with a typical response rate above 95%.
I’ve written about some of these changes in more detail, especially here, here, and here.
Regarding local data and demographic breakdowns, there are additional complications due to the relative lack of readily available census data. Often, the datasets that are publicly available do not offer the most detailed level of occupational data, which is the level required to count artist occupation groups. Some datasets cover, at best, metropolitan areas (not cities per se) and only have limited demographic breakdowns. Without multiple dataset options, it is much tougher to work around the above-noted “apples and oranges” challenges. My own requests have been the most consistent source of local information, but even those have changed over time, and they have not always covered the same definition of local communities or the same demographic categories.
Huge growth in the number of artists since 1991
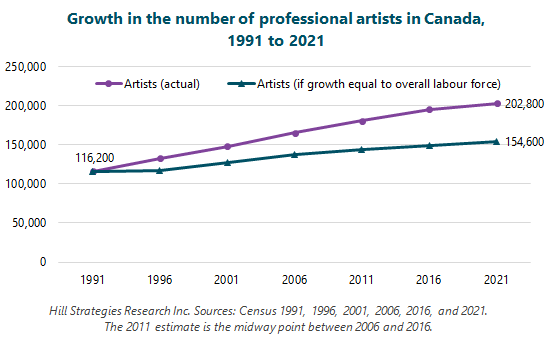
There are 75% more artists in the labour force than 30 years ago, compared with 33% growth in the overall labour force.
In 2021, there were 202,800 professional artists in Canada, compared with 116,200 in 1991.
Today’s first graph shows that, if the growth in professional artists had been the same as the overall labour force since 1991, there would be almost 50,000 fewer artists in Canada in 2021 (154,600 instead of 202,800).
Note that I am not considering the count of artists in 2011 to be comparable to other years because of the different methods of the (voluntary) National Household Survey in that year. For graphing purposes, I have imputed an estimate for 2011, which is the mid-point between the 2006 and 2016 estimates.


