Visual arts products: Revenues, direct impact on GDP, and jobs
Analysis of national data from 2012 to 2024
Today’s post focuses on the economy of the visual arts, including an analysis of key indicators in 2024 as well as trends since 2012. The estimates relate to visual arts products, i.e., the production of visual arts-related goods and services from cultural organizations, businesses, and individuals, as well as non-cultural ones.
The analysis is based on Canada-wide statistics from Statistics Canada’s National Culture Indicators for 2024. In the 2024 dataset, some visual arts products saw a notable revision of prior estimates for 2021 through 2023. In particular, previous estimates for crafts were revised downward. Because of this, my analysis today is not directly comparable to a similar analysis last year.
The visual arts include specific subdomains in Statistics Canada data:
Crafts
Photography
Original visual art
Art reproductions
Statistics Canada created the above subdomains, but the idea to combine them and call them visual arts is mine. In my opinion, it’s a reasonable but imperfect approximation of the sector.
Note that video-related artworks would likely be classified as film and video products, not visual arts ones. The above definition of the visual arts excludes separate subdomains for architecture, advertising, and design (areas that Statistics Canada combines with the visual arts in a broad category of “visual and applied arts”).
As is the case with every other breakdown of the arts, two broad and important categories are excluded from the statistics:
All government-owned visual arts venues, funding, and support organizations, which are included in the very broad category of “governance, funding, and professional support”
Education and training in the visual arts
Because of these exclusions, today’s statistics should be considered a minimum measurement of revenues, impacts, and jobs related to visual arts products.
Three key economic indicators are included:
Output (essentially an estimate of total revenues)
Direct impact on Gross Domestic Product (GDP)
Jobs
To add depth and context, I analyze the historical estimates of revenues and GDP in three ways: 1) as published by Statistics Canada (“nominal” statistics); 2) adjusted for inflation (“real changes”); and 3) adjusted for both inflation and population growth (“real per capita changes”).
The data sources and other notes are at the end of this article.
Over $12 billion in revenues in 2024
Total revenues for visual arts products, including crafts and photography, were $12.4 billion in 2024. Visual arts products account for one-third of all revenues in my admittedly imperfect measurement of arts products.
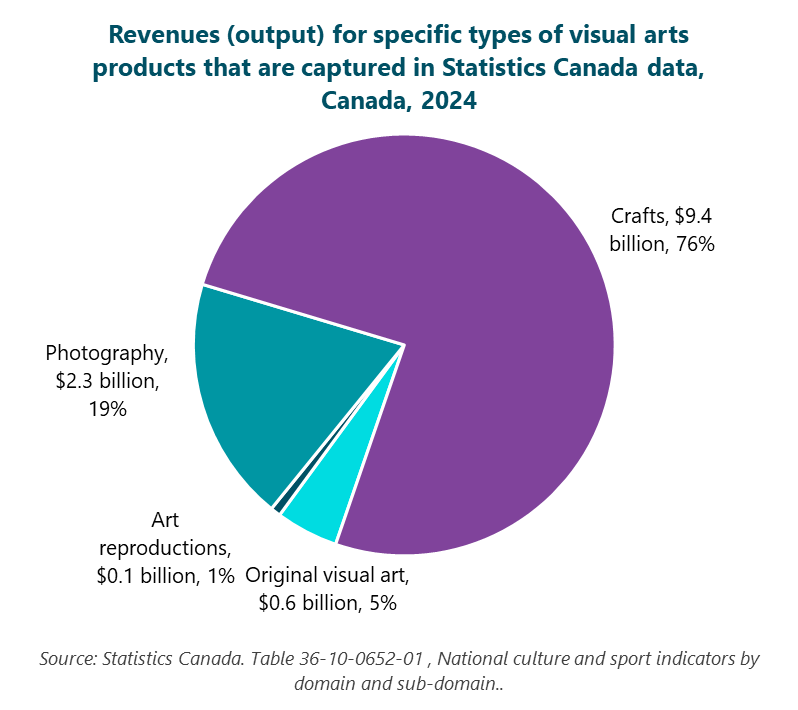
Today’s first graph provides a breakdown of total revenues (aka output) in areas that I’ve included in the visual arts. Crafts represent by far the largest share of revenues for visual arts products in 2024: $9.4 billion, or 76%. Next is photography, with $2.3 billion in revenues (19%). The other two areas represent much smaller shares of total revenues: original visual art ($593 million, or 5%) and art reproductions ($97 million, or 0.8%). These last two areas are expressed in billions in the graph below ($0.6 billion for original visual art and $0.1 billion for art reproductions).


