Economic performance of performing arts products in 2024
Jobs, revenues, and direct economic impact in 2024 and historical analysis from 2012
Today’s article examines key macroeconomic indicators for the performing arts in 2024 and trends since 2012. The analysis includes three key economic indicators:
Output (aka total revenues)
Direct impact on Gross Domestic Product (GDP)
Jobs
The analysis is based on Canada-wide statistics from Statistics Canada’s National Culture Indicators for 2024. In the 2024 dataset, the performing arts saw a notable revision of prior estimates for 2021 through 2023. In each of these years, the performing arts estimates were revised upward. Because of this, my analysis today is not directly comparable to a similar analysis last year.
To add depth and context, I analyze the historical estimates of revenues and GDP in three ways: 1) as published by Statistics Canada (“nominal” statistics); 2) adjusted for inflation (“real changes”); and 3) adjusted for both inflation and population growth (“real per capita changes”).
Today’s analysis indicates that the performing arts have surpassed pre-pandemic levels of revenues and impact on GDP (i.e., the levels in 2019), neither of which was the case in my analysis last year. However, after adjusting for inflation, neither total revenues nor impact on GDP have reached pre-pandemic levels. In addition, jobs related to performing arts products are not at the same level as in 2019.
The estimates relate to performing arts products, i.e., the production of goods and services from cultural organizations and industries as well as non-cultural ones. Estimates related to performing arts industries are available yearly via the Provincial and Territorial Cultural Indicators. I recently analyzed key provincial indicators for 2023, the most recent year available.
If you’ve followed my work closely, you may know this. But many readers may not:
The estimates of performing arts products = those produced within culture-related industries + those produced outside of culture-related industries. In 2023, the proportion of revenues for performing arts products coming from non-cultural industries was 21%.
The estimates of performing arts industries (not analyzed here due to data unavailability) = performing arts products produced within performing arts industries + other products (not performing arts) produced within performing arts industries.
Today’s article is freely available and shareable in both official languages thanks to the support of CAPACOA. My thanks to them for their continuing support!
What’s included and excluded from the “performing arts”?
Statistics Canada’s dataset provides estimates for performing arts products, a subdomain that accounts for almost all (95%) of the revenues in the parent “live performance” domain. The other 5% of revenues relate to a subdomain for festivals and celebrations involving live performances (but this percentage seems low to me).
Statistics Canada’s Canadian Framework for Culture Statistics indicates that the performing arts include “live performances of theatre, dance, opera, musical theatre, orchestras, music groups and artists, circuses, [and] puppetry”. The subdomain also “includes promoters and presenters involved with live performances, as well as the physical infrastructure used to house these events where these are facilities dedicated to live performance such as theatres or concert halls”.
It is important to understand that two important elements are excluded from the performing arts statistics:
All government-owned performance venues, funding, and support organizations, which are included in a separate category of “governance, funding, and professional support”
Education and training in the performing arts
Details about the data sources and other notes are provided at the end of this article.
Over $7 billion in revenues for performing arts products in 2024
Total revenues of performing arts products were $7.2 billion in 2024. As I noted in my article related to the arts as a whole, performing arts products represent 19% of all revenues in my admittedly imperfect measurement of the arts. (The full live performance domain. including the performing arts subdomain as well as performance-related festivals and celebrations, accounts for 20%.)
The performing arts economy over time
Basic facts: Current estimates and nominal changes since 2012
The “nominal” values in this section have not been adjusted for other important economic factors, such as inflation or changes in the population.
The $7.2 billion in revenues for performing arts products in 2024 is a nominal 71% increase from $4.2 billion in 2012.
The direct impact of performing arts products on GDP was $3.7 billion in 2024, a nominal 66% increase from 2012 ($2.2 billion).
In 2024, there were 68,300 full-time and part-time jobs related to performing arts products, which is a 29% increase from the 52,900 jobs in 2012.
Changes in revenues since 2012, including adjustments for inflation and population growth
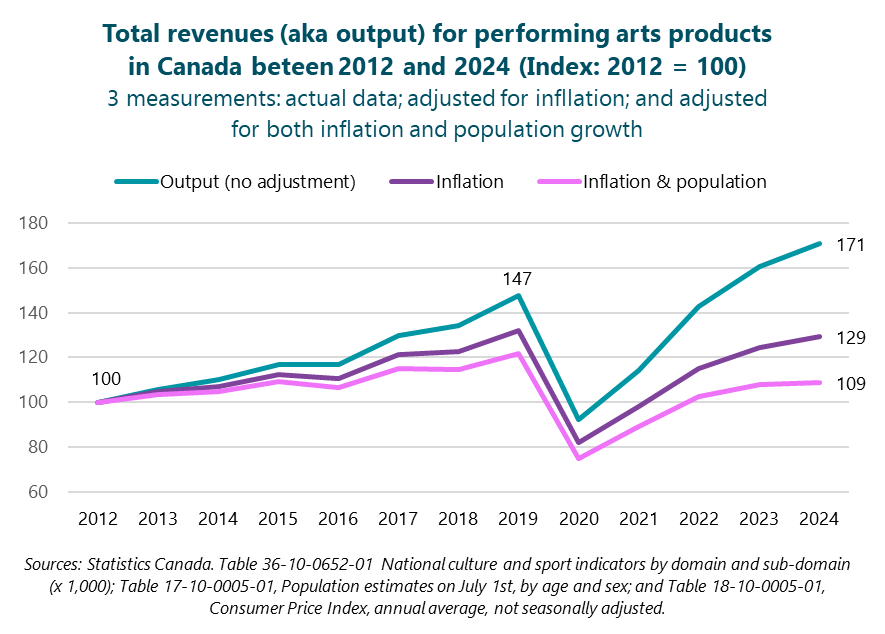
The first graph in today’s article provides three measurements of total revenues (aka output): the nominal estimates, inflation-adjusted estimates, and estimates that are adjusted for both inflation and population growth. Each line is an index that starts at 100 in 2012, the first year of comparable data.
The blue line shows the trend in nominal (unadjusted) revenues for performing arts products over time. This line increased significantly until reaching 147 in 2019, with a sharp decrease in 2020. The solid increases since 2020 have propelled the index of total revenues to 171 in 2024, 71% higher than the starting level in 2012 and well above the level in 2019 (index of 147).
After adjusting for inflation (aka “real changes”), revenues for performing arts products increased by 29% between 2012 and 2024, as shown by the purple line that ends in 129. 2019 was the highest level for the inflation-adjusted revenue estimate (index value of 132). In other words, after adjusting for inflation, revenues for performing arts products are just below pre-pandemic levels.
With adjustments for both inflation and population growth (aka “real per capita changes”), revenues for performing arts products increased by 9% between 2012 and 2024, as shown by the pink line that ends in 109. The highest level for the real per capita estimate also occurred in 2019 (index value of 122).
Changes in direct impact on Gross Domestic Product since 2012
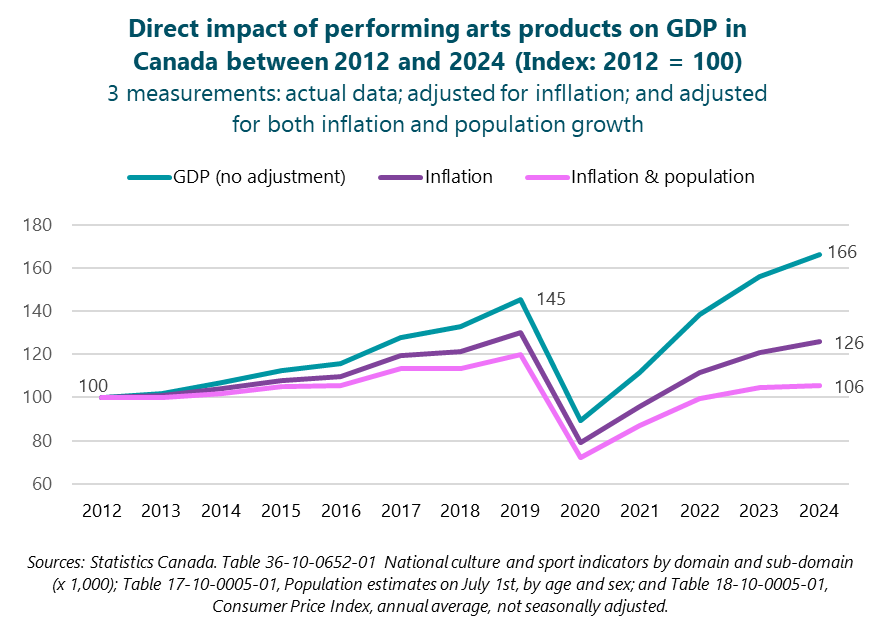
This section looks at three measurements of the direct impact of performing arts products on GDP: nominal estimates, inflation-adjusted ones, and ones that are adjusted for both inflation and population growth.
The unadjusted impact of performing arts products on GDP (the blue line in the below graph) increased to an index value of 145 in 2019, followed by a precipitous drop in 2020. There has been a full rebound since 2020, with the index reaching 166 in 2024.
The inflation-adjusted impact of performing arts products on GDP (purple line) had an index value of 126 in 2024, or 26% higher than its level in 2012. The year with the largest inflation-adjusted impact on GDP was 2019 (index value of 130). In other words, after adjusting for inflation, the GDP impact of performing arts products is slightly below pre-pandemic levels.
The pink line shows estimates that have been adjusted for both inflation and population growth. By this measurement, the direct impact of performing arts products on GDP has increased by 6% between 2012 and 2024. The highest level for the real per capita estimates was in 2019 (index value of 120).
Changes in jobs related to performing arts products since 2012
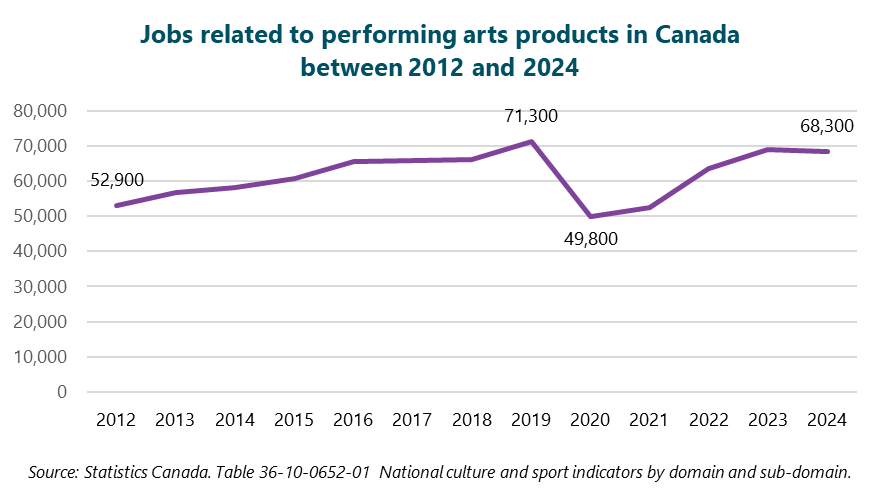
As noted above, the number of jobs related to performing arts products increased by 29% between 2012 (52,900) and 2024 (68,300). Further details are provided in the final graph in today’s article (non-indexed estimates of the number of full-time and part-time jobs related to performing arts products between 2012 and 2024).
The jobs graph, like the inflation-adjusted estimates of revenues and direct impact on GDP, shows a significant increase to a peak value in 2019 (71,300), followed by a huge decrease in 2020 (to 49,800) and a substantial rebound to 68,300 in 2024, slightly below the peak value.
Over the full timeframe, the 29% increase in jobs related to performing arts products is much higher than the 19% increase in Canada’s population between 2012 and 2024.
Data sources and notes
Sources: Statistics Canada, Table 36-10-0652-01. National culture and sport indicators by domain and sub-domain (for each quarter of 2024) and Culture and sport indicators by domain and sub-domain, by province and territory, product perspective (for annual statistics from 2012 to 2023).
The estimates of output (or “total revenues”) are quite broad: they are gross (not net) figures and include some multiple counting within the performing arts (i.e., when transactions are conducted between organizations or individuals within the performing arts). In contrast, the GDP statistics provide a measure of the net value-added to the economy.
The product-based estimates in today’s article are typically smaller than industry-based estimates. I am focusing on the product-based estimates simply because they are available much more quickly than the industry-based ones, which likely won’t be available for close to another year.
The GDP and jobs estimates capture direct impacts only and are therefore relatively modest. Excluded are commonly measured elements such as indirect impacts (the re-spending of the expenditures of arts organizations) and induced impacts (the re-spending of wages earned by arts workers and suppliers’ workers). Despite the smaller numbers, the narrower approach does provide estimates that are comparable between jurisdictions.
The estimates of jobs include both full-time and part-time positions and are not expressed on a full-time-equivalent basis.


