Do arts, heritage, and entertainment organizations in each province consider themselves better or worse off now than before the pandemic?
Part 2: Provincial analysis
Last week, I examined data how many Canadian organizations and businesses in the arts, heritage, and entertainment believe that they are in better (or worse) shape now than before the pandemic.
Today, I’ll dig into similar indicators for each province, as well as a measurement of the overall changes in the number of organizations and businesses between since early 2020.
How well or poorly do organizations in each province say that they are doing now, compared with 2019? Are there substantial differences between the provinces in terms of how many organizations say that they are doing worse (or better)?
Like last week, my analysis focuses on data for Statistics Canada’s “arts, entertainment, and recreation” industry group, often the closest approximation of the arts in their datasets. This industry group includes: 1) performing arts, spectator sports, and related industries; 2) heritage institutions; and 3) amusement, gambling, and recreation industries. The cultural industries are excluded (e.g., publishing, motion pictures, sound recording, and broadcasting), because they are grouped into “information and cultural industries”, along with software, telecommunications, and data processing and hosting.
Provincial changes in the number of arts, heritage, and entertainment organizations and businesses
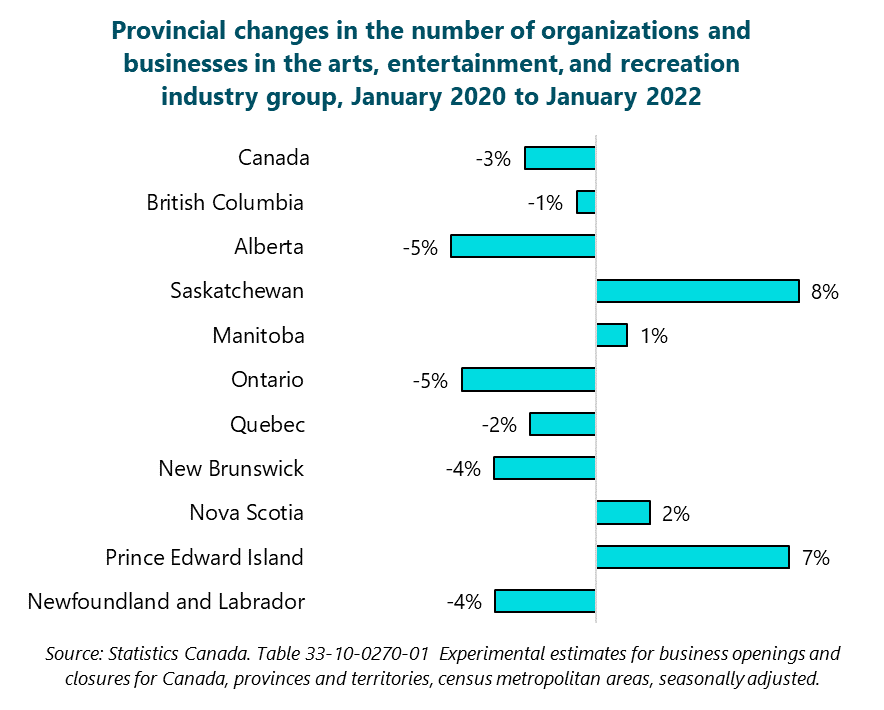
In Canada, there has been a 3% decrease in the number of organizations and businesses with at least one employee in the arts, entertainment, and recreation industry group (between January 2020 and January 2022). This stands in contrast to the 2% increase in businesses and organizations in all sectors of the economy.
The net loss of organizations and businesses varies significantly by province. In fact, there are four provinces in which there has been an increase in the number of organizations and businesses with at least one employee in the arts, entertainment, and recreation industry group.
(Source: My analysis of the raw data from January 2022 in Statistics Canada. Table 33-10-0270-01: Experimental estimates for business openings and closures for Canada, provinces and territories, census metropolitan areas, seasonally adjusted.)
As shown in the following graph, most provinces saw a decrease in the number of organizations and businesses in the arts, entertainment, and recreation industry group, including Alberta (-5%), Ontario (also -5%), Newfoundland and Labrador (-4%), New Brunswick (also -4%), Quebec (-2%), and BC (-1%). On the other hand, there were increases in Saskatchewan (+8%), PEI (+7%), Nova Scotia (+2%), and Manitoba (+2%).
Are more of the surviving organizations in a better or worse position now?
The analysis below is based on a question asked of arts, entertainment, and recreation organizations and businesses (with at least one employee) in April of 2022:
Is this business or organization in a better overall position today than it was in 2019?
Yes, this business or organization is in a better overall position now
This business or organization is in about the same overall position now compared with 2019
No, this business or organization is in a worse overall position now
Don't know
Statistics Canada’s provincial estimates for this question have quality ratings of “good” or “acceptable”. Not perfect, but not bad for such detailed data broken down by province.
In 9 of the 10 provinces, more organizations and businesses in the arts, entertainment, and recreation were worse off than better off in early 2022 compared with 2019. This indicates that the arts and heritage sector across the country has not fully recovered from the pandemic.
Nationwide, 10% fewer organizations and businesses in the arts, entertainment, and recreation are in a better position now (24%) than in a worse position (34%), compared with 2019. This is shown as -10% in the following graph of “net better position”.
A “net worse” situation holds in 9 of the 10 provinces, the only exception being Newfoundland and Labrador (where 2% more organizations and businesses are in a better than a worse position). The net worse situation is the most extreme in PEI (-42%), Ontario (-17%), BC (-15%), Manitoba (-13%), and Saskatchewan (-11%).
Comparisons with all businesses and organizations in each province
The difficulties in the arts, entertainment, and recreation industry group are not reflective of the overall situation in each province. In fact, in 8 provinces, the “net better position” is worse in the arts, entertainment, and recreation than for all businesses and organizations. The following graph shows statistics for all industries in each province (comparable to the graph above for the arts, entertainment, and recreation industry group).
Finally, the table below provides more details of the responses of organizations and businesses in each province.


