
Government spending on culture in Prince Edward Island in 2023-24
Analysis of current data and historical trends, including per capita spending

A recent analysis by Hill Strategies of spending on culture by Canada, the provinces, territories, municipalities, and educational institutions showed that governments at all levels invested $13 billion on culture in 2023-24. The federal government spent $5.4 billion, or 41% of all government spending on culture in 2023-24. Provinces, territories, municipalities, and educational institutions invested $7.6 billion on culture, representing 59% of all government spending on culture.
This report analyzes spending in PEI, not just spending by the Province of Prince Edward Island. The analysis includes non-federal levels of government and quasi-governmental organizations:
The provincial government and its agencies
Municipal governments and their agencies
Educational institutions
Health care establishments (which likely have little or no direct spending on culture)
The dataset does not offer separate data for each level of government within the province, nor does it allocate federal spending by province. These breakdowns are therefore not possible.

The article is made possible with the support of Creative PEI. Hill Strategies retained editorial control of the content.

The Statistics Canada dataset that underpins this report offers two categories that fit within a typical statistical definition of the arts, culture, and heritage: 1) broadcasting and publishing services; and 2) culture, excluding broadcasting and publishing. For PEI, Statistics Canada did not identify any spending on broadcasting and publishing. All of the cultural funding in the province falls under the second category (which the dataset calls “cultural services”).
For each element of government spending, the data include direct government support, not tax credits or other indirect instruments.
The 2023-24 data are labelled as “preliminary” and may therefore be adjusted in the next update of the dataset.
The data source and other important notes are included at the end of this report.
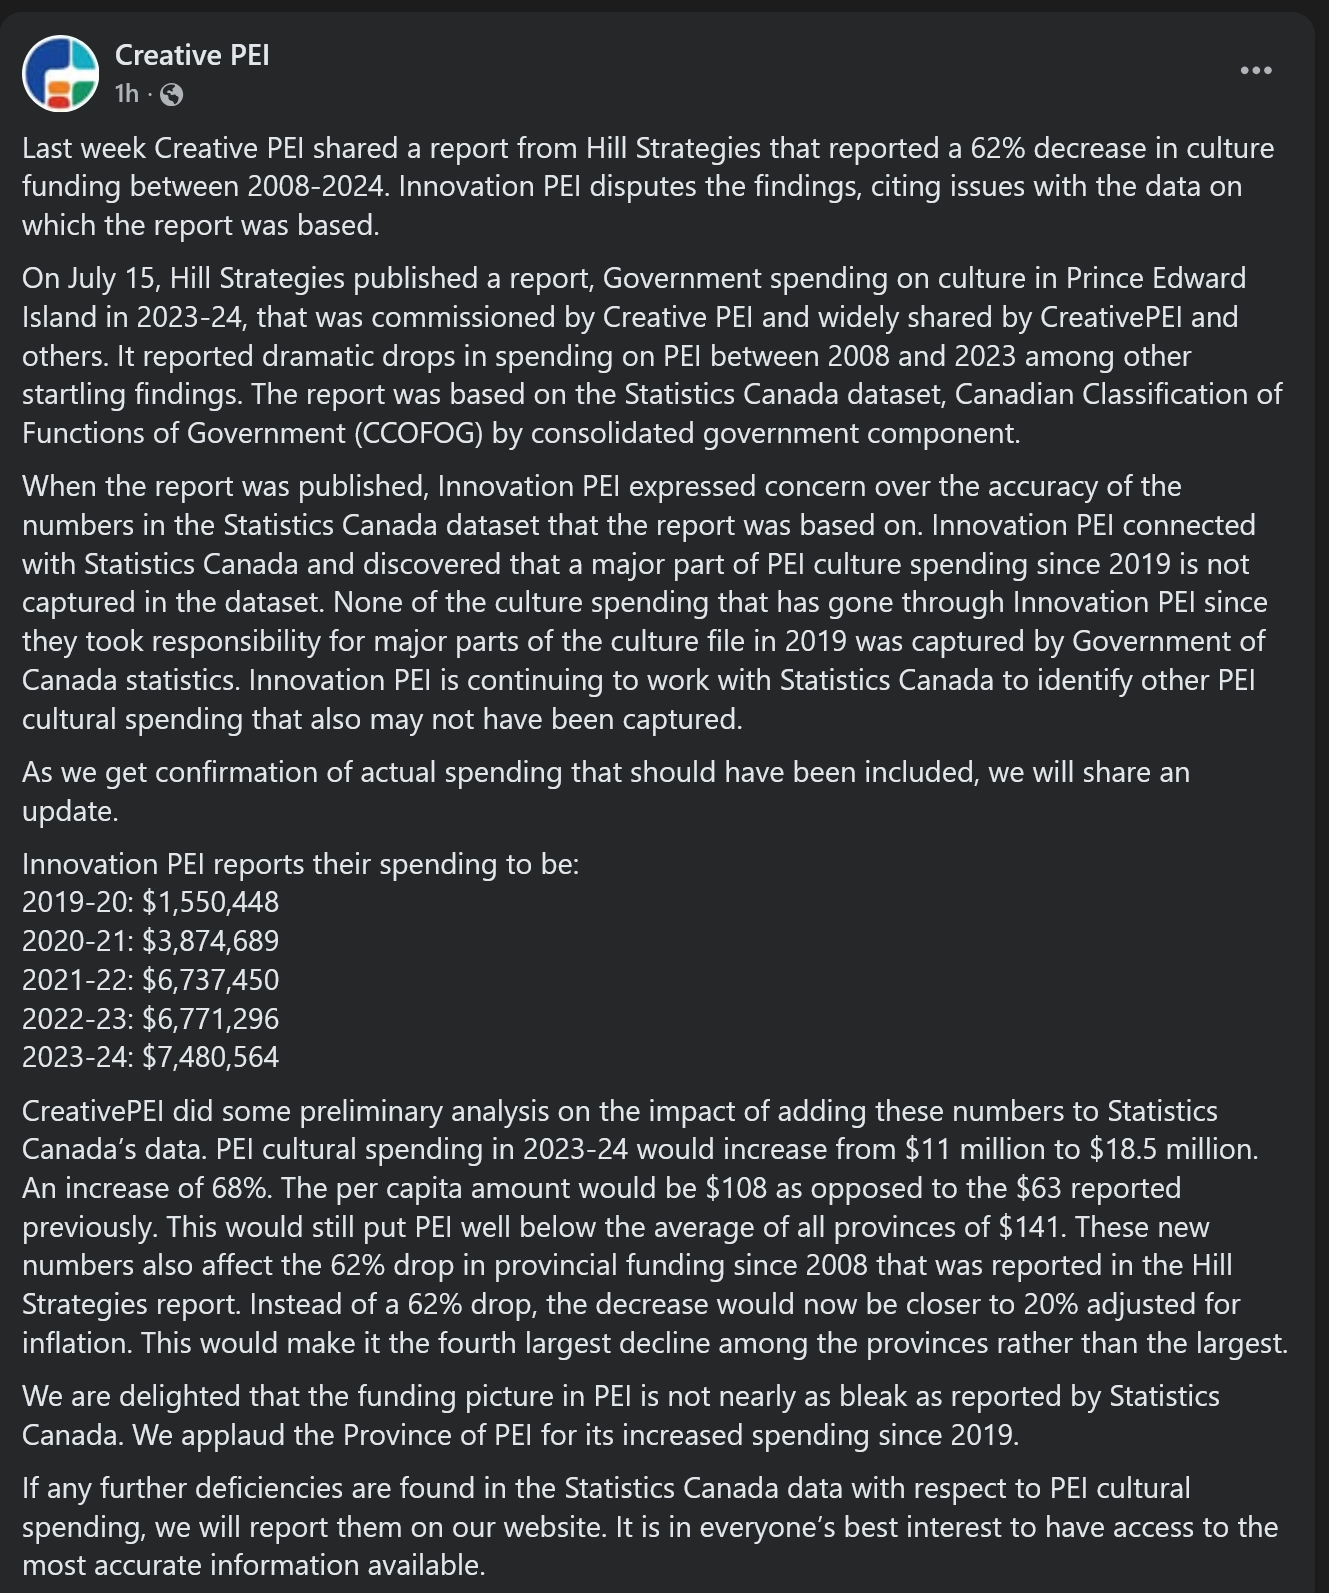
Update from Creative PEI on July 23 regarding the source data
Government spending on culture represents 0.4% of government spending in PEI
In 2023-24, the province, municipal governments, and educational institutions in PEI spent $11 million on culture, which represents just 0.4% of total government spending in the province, as shown in the following graph.
 by consolidated government component.")
Culture’s proportion of government spending: Comparison with other provinces
In the provinces and territories, governments typically spent 0.8% of their total expenditures on culture in 2023-24. (This is the median level of spending, which is also the level in Saskatchewan.) As shown in the following graph, governments in B.C. spent the most as a percentage of total spending in 2023-24 (1.5%), followed closely by governments in Quebec (1.3%). PEI’s 0.4% of total government spending is tied for second lowest, slightly ahead of New Brunswick.
 by consolidated government component (Table 10-10-0005-01).")
Per capita spending on culture: Comparison with other provinces
The $11 million investment in culture in PEI in 2023-24 represents $63 per resident, ranking second last among the 10 provinces. The median spending on culture by non-federal levels of government was $127 per capita in 2023-24. Governments in Quebec spent the most per capita ($268), followed closely by governments in British Columbia ($264). Governments in PEI invest one-half the median spending level among the provinces and about four times less than the spending levels in the two leading provinces.
The following graph depicts the per capita spending level in each province.
 by consolidated government component (Table 10-10-0005-01) and Population estimates on July 1st, by age and gender (Table 17-10-0005-01)")
Government spending on culture in PEI compared with other economic sectors
The $11 million spent on culture in PEI is lower than the amount that governments spent on recreation, sports, and religion ($16 million). Government spending in many other areas also exceed spending on culture, as shown in the following graph. For example, government investment in the category of economic affairs was $408 million in 2023-24, which is 37 times more than the investment in culture. Within this category, government spending on agriculture, forestry, fishing, hunting ($81 million) is seven times larger than spending on culture. The economic affairs category also includes spending on transport, manufacturing, construction, and others.
 by the province, municipalities and educational institutions in PEI, 2023-24 Culture : 0.4%. Recreation & religion : 0.5%. Education : 20%. Public order & safety : 4%. Housing & community amenities : 0.6%. Health : 33%. Economic affairs : 14%. Environmental protection : 4%. General public services : 14%. Social protection : 10%. Source: Statistics Canada. Table 10-10-0005-01. Canadian Classification of Functions of Government (CCOFOG) by consolidated government component.")
Trends in government spending on culture in PEI
Government spending on the arts, culture, and heritage decreased from $17 million in 2008-09 to $11 million in 2023-24, a 35% decrease, even before adjusting for inflation and population growth. As shown in the following graph, government spending on culture peaked in 2013 ($26 million).
, 2008-09 to 2023-24. 2008: $17 million. 2009: $17 million. 2010: $19 million. 2011: $17 million. 2012: $19 million. 2013: $26 million. 2014: $16 million. 2015: $13 million. 2016: $13 million. 2017: $13 million. 2018: $14 million. 2019: $11 million. 2020: $10 million. 2021: $10 million. 2022: $10 million. 2023: $11 million. Sources: Statistics Canada. Canadian Classification of Functions of Government (CCOFOG) by consolidated government component (Table 10-10-0005-01) and Population estimates on July 1st, by age and gender (Table 17-10-0005-01).")
Unlike in PEI, average spending on culture in the provinces grew between 2008-09 and 2023-24 (before adjustments for inflation and population growth).
The following graph depicts how government spending on culture in PEI would have grown if it had kept up with the average in all provinces. In 2023-24, spending on culture in PEI would have been $33 million if it had kept up with the average in all provinces, which is three times as large as actual spending in that year.
 PEI: 2008, $17 million. 2009, $17 million. 2010, $19 million. 2011, $17 million. 2012, $19 million. 2013, $26 million. 2014, $16 million. 2015, $13 million. 2016, $13 million. 2017, $13 million. 2018, $14 million. 2019, $11 million. 2020, $10 million. 2021, $10 million. 2022, $10 million. 2023, $11 million. Average in all provinces: 2008, $17 million. 2009, $17 million. 2010, $17 million. 2011, $19 million. 2012, $20 million. 2013, $19 million. 2014, $20 million. 2015, $22 million. 2016, $22 million. 2017, $24 million. 2018, $26 million. 2019, $27 million. 2020, $28 million. 2021, $28 million. 2022, $31 million. 2023, $33 million. Sources: Statistics Canada. Canadian Classification of Functions of Government (CCOFOG) by consolidated government component (Table 10-10-0005-01) and Population estimates on July 1st, by age and gender (Table 17-10-0005-01).")
The following data have been adjusted for both inflation and population growth (sometimes called “real, per capita changes”).
As noted above, the $11 million spent on culture by the province, municipalities, and educational institutions in 2023-24 equals $63 per resident. After adjusting for inflation and population growth, this is a 62% decrease from the $169 spent in 2008-09.
The following graph highlights the changes in cultural spending in PEI between 2008-09 and 2023-24 (adjusted for inflation and population growth). Government spending on culture peaked at $231 per person in 2013-14. Spending on culture was lowest at the end of the 15-year timeframe: $62 per capita in 2022-23 and $63 in 2023-24.
 by consolidated government component (Table 10-10-0005-01) and Population estimates on July 1st, by age and gender (Table 17-10-0005-01).")
Between 2008-09 and 2023-24, overall spending by the province, municipalities, and educational institutions in PEI increased from $15,164 to $18,032 per capita (adjusted for inflation). The 14% increase in overall government spending stands in sharp contrast to the 62% decrease in government spending on culture. The following graph highlights these percentage changes.
Government spending on culture represented 1.1% of overall spending in 2008-09 and 0.4% in 2023-24.
 Overall government spending: 14%. Culture: -62%. Sources: Statistics Canada. Canadian Classification of Functions of Government (CCOFOG) by consolidated government component (Table 10-10-0005-01) and Population estimates on July 1st, by age and gender (Table 17-10-0005-01).")
Changes in real, per capita spending on culture: Comparison with other jurisdictions
There are substantial differences in the changes in government spending on culture between the provinces and territories, as depicted in the following graph (with all percentages adjusted for inflation and population growth). The median change is 0%, which is also the change in Yukon. The jurisdictions with the highest increases between 2008-09 and 2023-24 are Quebec (69%), Saskatchewan (29%), Nunavut (23%), and British Columbia (20%).
PEI had the largest decrease among the 13 provinces and territories. As noted above, governments in PEI decreased their spending on culture by 62% between 2008-09 and 2023-24. Alberta (-49%) and New Brunswick (-36%) also saw significant decreases in cultural spending.
 by consolidated government component (Table 10-10-0005-01) and Population estimates on July 1st, by age and gender (Table 17-10-0005-01).")
Sources and notes
Statistics Canada. Table 10-10-0005-01. Canadian Classification of Functions of Government (CCOFOG) by consolidated government component, https://www150.statcan.gc.ca/t1/tbl1/en/tv.action?pid=1010000501
The inflation and per capita calculations were made using data from Consumer Price Index, annual average, not seasonally adjusted and Population estimates on July 1st, by age and sex.
The province, local governments, and educational institutions
The dataset contains just two categories of government levels, and this report analyzes cultural spending by the province, local governments, and educational institutions. The database refers to this grouping as “Consolidated provincial-territorial and local governments”, which include “provincial and territorial governments, health and social service institutions, universities and colleges, municipalities and other local public administrations, and school boards.” Breakdowns within this category are not available in the dataset. We cannot separate spending by the province from local governments and educational institutions: all are included in the same broad category.
Cultural categories
The dataset describes the two cultural categories as follows:
Culture, excluding broadcasting and publishing (what Statistics Canada calls “cultural services”). This covers much of what we would usually consider to be funding for the arts, culture, and heritage. Definition: “This group covers provision of cultural services; administration of cultural affairs; supervision and regulation of cultural facilities; operation or support of facilities for cultural pursuits (libraries, museums, art galleries, theatres, exhibition halls, monuments, historic houses and sites, zoological and botanical gardens, aquaria, arboreta, etc.); production, operation, or support of cultural events (concerts, stage and film productions, art shows, etc.); and grants, loans, or subsidies to support individual artists, writers, designers, composers, and others working in the arts or to organizations engaged in promoting cultural activities.”
Broadcasting and publishing services. Definition: “This group covers administration of broadcasting and publishing affairs; supervision and regulation of broadcasting and publishing services; operation or support of broadcasting and publishing services; grants, loans, or subsidies to support the construction or acquisition of facilities for television or radio broadcasting; the construction or acquisition of plant, equipment, or materials for newspaper, magazine, or book publishing; the production of material for, and its presentation by, broadcasting; the gathering of news or other information; and the distribution of published works.”
There is a combined category for “recreation, culture, and religion, not elsewhere classified” that might include some cultural spending. In 2023-24, there was $1 million in government spending in PEI in this category, compared with $11 million in the other two cultural categories. The amounts that are “not elsewhere classified” have not been included in the calculations of government spending on culture, because there is no way of knowing the cultural proportion of this spending. To better understand the potential magnitude of this spending, we could assume that spending on culture represents one-half of the not-elsewhere-classified category. In this case, total spending on culture would be $0.5 million or 5% higher than the total amount reported in this report. This potential undercounting has remained consistent and would therefore not affect the changes over time.
We cannot break down the two key cultural categories (into, say, spending on “the arts”). Data are available for these categories, which are also rolled up into a broader category for spending on “recreation, culture, and religion”.
Yearly data cutoffs
The provincial government operates on a fiscal year that ends in March. Spending for the fiscal year is allocated to the calendar year containing the first nine months of the fiscal year, not the year in which the fiscal year ended. In other words, spending in fiscal 2023-24 is published as spending in 2023. The data released in late November of 2024 cover the fiscal year ending March 31, 2024.
Thanks for this Kelly! Not the best news, but great to have the numbers to advocate for change!
Hi Kelly, given the Innovation PEI revisions - what are the odds that similar problems existing Stats Can data for other smaller jurisdictions. I am using this report for some work in New Brunswick right now ... SI am also consulting CRA charitable listings and CADAC, with each having its own issues re: completeness and categorization of revenue/spending. Thanks.