The donor pool is getting smaller: Decrease in charitable donors both recently and over the longer term
My analysis of broad datasets, not arts-specific, shows that money is coming from fewer and fewer donors
Time for a change of pace. I’ve done a lot of analysis of census data over the past several months. I’ve recently taken the time to investigate other datasets and found a number that deal with donors and donations.
Today I’ll analyze data related to donors and donations to all types of charities, based on tax filings from 1997 through 2022. Next week, I’ll dig into other datasets that offer insights into donations and fundraising in arts, culture, and heritage organizations. I am not yet certain whether reliable provincial data are available from those datasets. If they are, I will either include them next week or create a third post with provincial analysis.
Not-for-profit organizations, including arts organizations, are facing serious headwinds right now. Rising costs are affecting organizations’ own expenditures and, in the case of charitable organizations, the ability of many Canadians to donate to them.
As Imagine Canada has noted, “a [2022] Angus Reid poll found that 54% of Canadians have decreased their charitable giving in response to the rising cost of living, with 30% having decreased their giving ‘a great deal’. The poll shows that charitable giving is one of the most common places people are cutting back spending.”
The short term and longer term trends differ slightly. Over the longer term, the value of donations has increased, but there was a decrease in donations from 2021 to 2022. One consistent finding is that …
there has been a steady decline in the number of donors. The net effect is that donations are coming from a smaller and smaller pool of donors.
Long term analysis: Decrease in charitable donors, increase in the value of donations
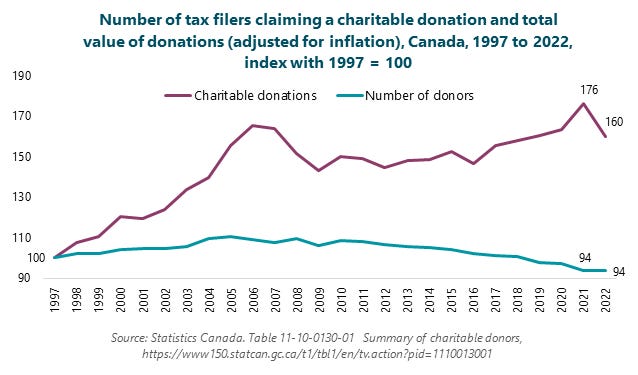
The following graph shows that the value of charitable donations has increased substantially over the past 25 years. In 2021, charitable donations were 76% higher than in 1997 (after adjusting for inflation). In 2022, there was a substantial decrease, leaving donations in the most recent data year 60% higher than in 1997 but 9% lower than in 2021. Including the inflation adjustment, the value of donations to all types of charities was slightly lower in 2022 ($11.4 billion) than before the pandemic ($11.5 billion in 2019).
The graph also shows that the number of tax filers claiming a charitable donation decreased by 6% between 1997 and 2022. The decline has been slow but steady. However, the decrease is more substantial when expressed as a percentage of all tax filers: the proportion claiming charitable donations was 26% in 1997 and 17% in 2022.
The key statistics, not indexed and with the value of donations adjusted for inflation, are:
1997: 5.3 million charitable donors, or 26% of all tax filers. Value of donations = $7.2 billion.
2021: 5.0 million charitable donors, or 18% of all tax filers. Value of donations = $12.6 billion.
2022: 5.0 million charitable donors, or 17% of all tax filers. Value of donations = $11.4 billion.
The graph below shows that both the average and the median value of charitable donations have increased since 1997, with the average increasing by much more than the median.
The inflation-adjusted values are:
1997: Average donation of $1,352 and median (or typical) donation of $284.
2021: Average donation of $2,538 (88% higher than in 1997) and median donation of $384 (35% higher than in 1997).
2022: Average donation of $2,308 (71% higher than in 1997) and median donation of $380 (34% higher than in 1997).
2021 to 2022: Decrease in both the number of donors and the value of donations
In a recent article, Statistics Canada focused on the 2022 data and changes from 2021, including the following key findings:
The value of charitable donations decreased by 3.1% between 2021 ($11.8 billion) and 2022 ($11.4 billion). The decline would have been more severe if these figures had been adjusted for the 6.8% inflation in 2022 (which is what I did in preparing the above graphs).
“The overall decline in charitable donations in 2021 was driven by British Columbia (-11.8%) and Ontario (-6.0%).”
“Manitoba remained Canada's most charitable province in 2022 with just under one in five tax filers (19.3%) declaring a donation on their tax form.”
“The older the tax filer, the more likely they are to make charitable donations.”
“For every $100 donated in 2022, $1 came from those aged 24 and younger, while $48 came from those aged 65 and older.”
Using the same phrasing, but related to incomes rather than age, for every $100 donated in 2022, $59 came from those with incomes of $100,000 or more. For context, people who declared at least $100,000 in income represent just 13% of all tax filers.
“Men are more likely to declare charitable donations than women and give more overall.”
Links to the sources for this article
Statistics Canada, Table 11-10-0130-01, Summary of charitable donors, https://www150.statcan.gc.ca/t1/tbl1/en/tv.action?pid=1110013001
Fewer charitable donors, less money donated in 2022, https://www150.statcan.gc.ca/n1/daily-quotidien/240314/dq240314b-eng.htm
Canada Helps, From Disconnection to Action: The Giving Report 2024, https://www.canadahelps.org/en/the-giving-report/


