Changes in consumer spending on the arts, culture, and heritage between 2019 and 2023
National and provincial analysis
Today, I examine recent changes in consumer spending on the arts, culture, and heritage in Canada and each province. The analysis in this article starts in 2019, because the survey questionnaire was thoroughly redesigned in that year, making it largely not comparable to prior years.
The article focuses on changes in the following key indicators for each jurisdiction:
Average spending per household on artworks and arts participation
Spending on artworks and arts participation as a percentage of total consumption
Average spending per household on the arts, culture, and heritage
Cultural spending as a percentage of total consumption
My category of “artworks and arts participation” includes six items: 1) works of art, carvings, and other decorative ware; 2) books; 3) tickets to live performances; 4) movie tickets; 5) admissions to museums, zoos, and other heritage sites; and 6) art and craft materials. The 19 cultural goods and services include these six items, plus 13 others, all of which are listed at the end of this article.
These groupings include spending items that are available in the dataset. Given the limitations of Statistics Canada’s Survey of Household Spending, I would consider the resulting analysis to be a limited but reasonable approximation of consumer spending on the arts. I would consider the broader estimate of spending on culture (including the arts, culture, and heritage) to be a less-limited approximation, but still imperfect. Please refer to the notes at the end of the article for important methods and limitations.
Spending details for individual items that are included in arts spending and cultural spending are not provided in today’s article, due to space and time limitations.
Recap of national data from 2023
As I noted in a previous article, Canadians spent an average of $1,623 per household on cultural goods and services in 2023, for a total of $27 billion. This represents 2.1% of total consumer spending in the country (after taxes, pension contributions, and gifts are excluded). Canadian households spent an average of $531 on artworks and arts participation items, for a total of $8.8 billion, representing 0.7% of total consumer spending.
Recent changes in spending on the arts and culture
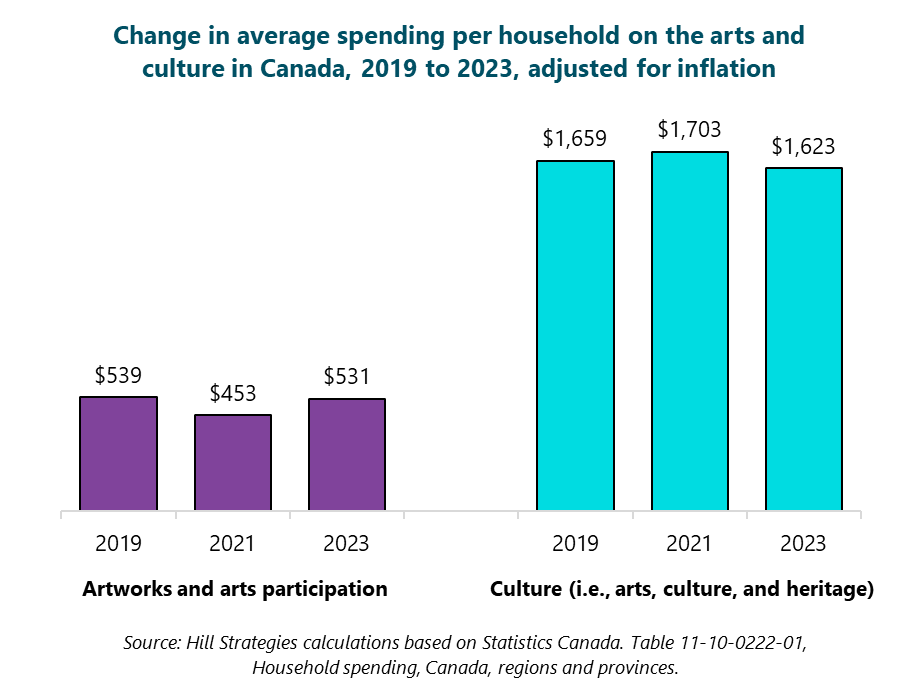
In Canada, consumer spending on artworks and arts participation changed very little between 2019 ($539 per household) and 2023 ($531). The estimate was lower in 2021 ($453), likely due to pandemic-related restrictions.
CORRECTION (Oct. 29): The broader category of consumer spending (arts, culture, and heritage) also changed very little between 2019 ($1,659 per household) and 2023 ($1,623). The estimate was slightly higher in 2021 ($1,703).
These estimates have been adjusted for inflation.
The corrected graph is now shown. There are no other data corrections.
The second graph examines spending on the arts and culture as a percentage of household budgets, which is followed by an examination of changes in each province. Spending levels, and spending as a percentage of household budgets, vary between the provinces.


