
Communications accessibility features are not common among organizations and businesses in the arts, heritage, and entertainment in Canada
Also: Reasons why organizations don’t incorporate accessibility features

Communicating with the public is an important part of what many organizations and businesses in the arts, heritage, and entertainment do. However, my analysis shows that relatively few organizations and businesses incorporate accessibility features into their public communications.
The article is based on a Statistics Canada survey of organizations and businesses across the economy. The survey was conducted between October 1 and November 5, 2025, and the data were released on November 25.
Survey questions
Here is the wording of the questions asked in this iteration of the Canadian Survey on Business Conditions.
Forms of communication
“Over the last 12 months, has this business or organization used any of the following forms of communication with customers or the public?
Forms of communication refers to the different ways information is provided, such as in person, over the phone, virtually, or printed materials with customers or the public.
Select all that apply.
Printed materials distributed by this business or organization (e.g., advertising materials, menus, forms, magazines, pamphlets)
Virtual communication (Include communication through email, websites, virtual meetings (e.g., Zoom, Microsoft Teams) or chat bots. Exclude social media posts.)
Social media (e.g., promoting or branding on social media platforms such as Facebook, Instagram, LinkedIn, X, Snapchat)
Communication in person or over the phone (Include text messages.)”
Accessibility features
Follow-up questions were only asked to respondents who indicated that they engaged in that form of communication. Each follow-up question started with: “Over the last 12 months, did this business or organization provide any accessibility features when communicating [via this form of communication]? Accessibility refers to ensuring that persons with disabilities can easily use and understand things like websites, documents, and services.”
Examples were given for each form of communication:
Via printed materials: “e.g., alternate formats, large print versions, accessible file formats or audio formats”
Virtually: “e.g., live captions, screen display options such as dark mode or high contrast, screen reader support”
Through social media platforms: “e.g., alternate text descriptions, videos with sound and captioning, closed captioning, plain language”
In person or over the phone: “e.g., visual aids, volume controllers, video relay service (VRS), speech-to-text services”
Few organizations or businesses in the arts, heritage, and entertainment incorporate accessibility features in their communications
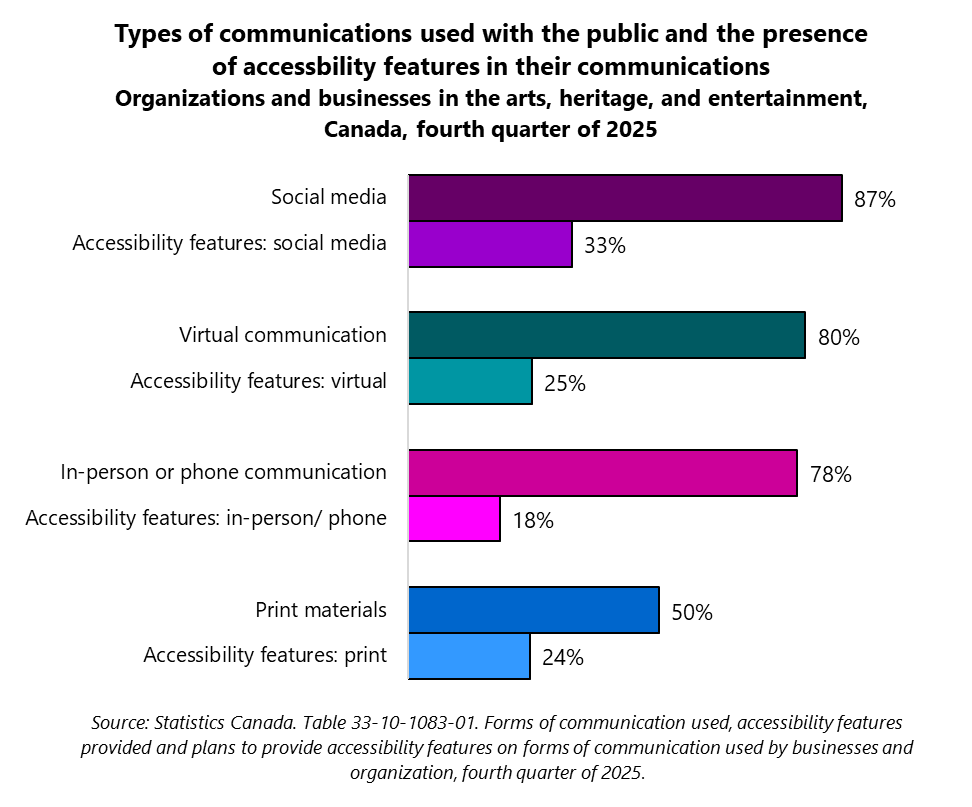
In the following paragraph, I’ll simplify “organizations and businesses in the arts, heritage, and entertainment” to just “organizations”. Because the follow-up questions about accessibility features were only asked to respondents who indicated that they engaged in each form of communication, the second bars in the following graph should be interpreted as “the percentage of organizations and businesses in the arts, heritage, and entertainment that communicate with the public in this way”, not “the percentage of all organizations and businesses in the arts, heritage, and entertainment”.
The following graph shows that, while nearly nine in every ten organizations in the arts, heritage, and entertainment (87%) communicate via social media, only 33% of those who use social media incorporate accessibility features such as alt text descriptions or captioning.
Eight in every ten organizations (exactly 80%) engage in virtual communication, but only 25% of those that communicate in this way offer accessibility features such as live captions, dark mode, or high contrast.
While nearly eight in every ten organizations (78%) communicate with customers in person or on the phone, only 25% of organizations that do so also provide accessible options such as visual aids, volume controllers, or speech-to-text services.
Finally, exactly one-half of organizations (50%) communicate via print materials, but only 24% of those that communicate in this way offer accessibility features such as alternate formats, large print versions, accessible file formats, or accessible audio formats.
If you’re curious, I always offer alt text descriptions in my online articles and social media posts. However, I find it challenging to balance plain language descriptions with precise technical language.
Comparisons with all organizations and businesses
Forms of communication
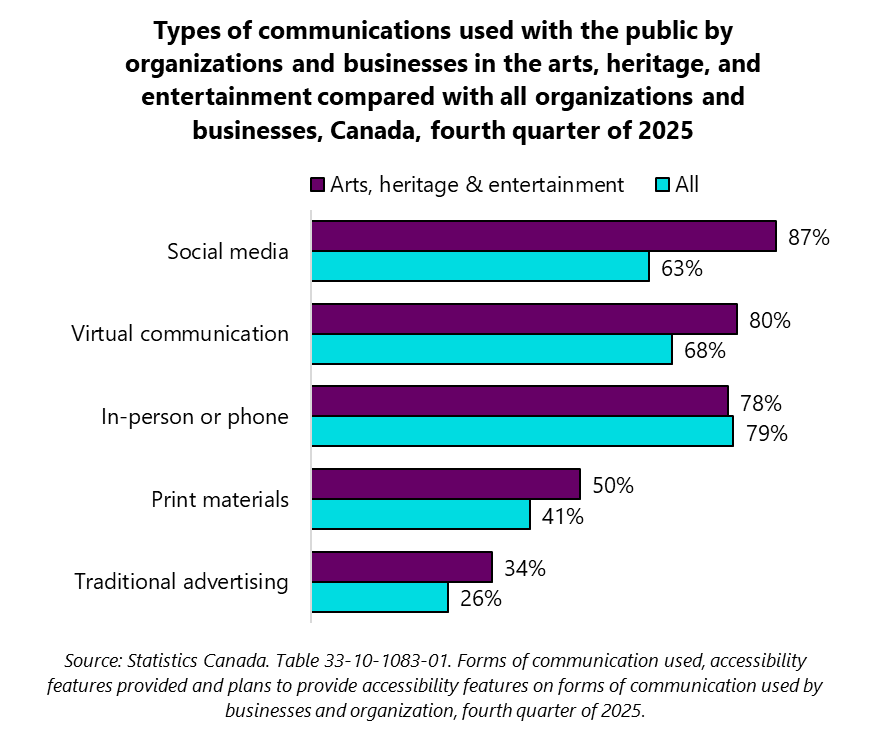
Organizations and businesses in the arts, heritage, and entertainment are more likely than other organizations and businesses to interact with the public via most forms of communication, as shown in the graph below. The difference is particularly large for social media.
Accessibility features
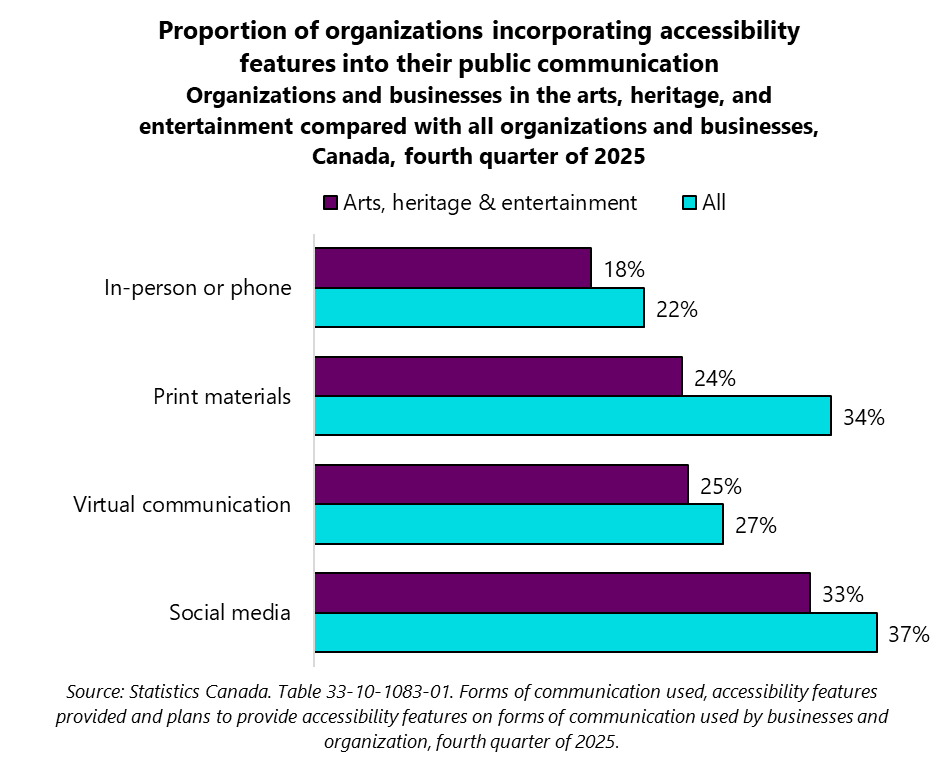
Organizations and businesses in the arts, heritage, and entertainment are less likely than other organizations and businesses to incorporate accessibility features into their communication with the public, as shown in the graph below. The difference is particularly large for printed materials.
Once again, the bars in the following graph should be interpreted as the percentage of organizations and businesses that communicate with the public in this way, not the percentage of all organizations and businesses.
Perceived lack of benefits to incorporating accessibility features
Respondents who do not incorporate accessibility features in any of their public communications were asked why they do not do so.
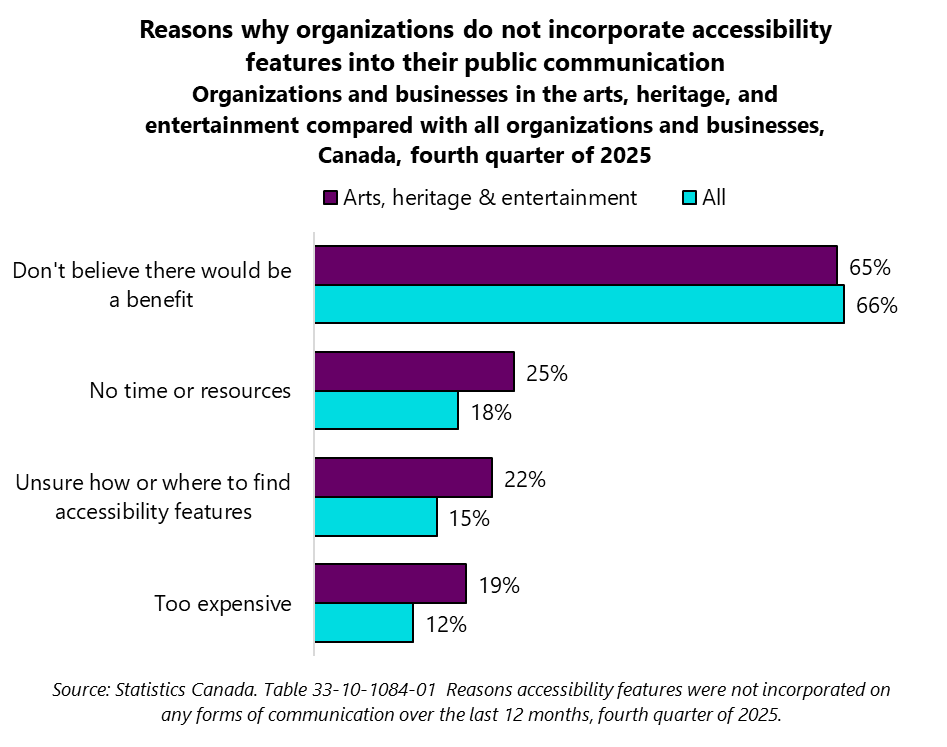
The survey results show that there is one main reason why organizations and businesses in the arts, heritage, and entertainment do not incorporate accessibility features into their public communication: they do not see how such features would benefit their organizations.
Two-thirds of organizations and businesses in the arts, heritage, and entertainment that do not incorporate accessibility features into their communications agreed with this option. This percentage is essentially equal to that for all organizations and businesses in Canada, as shown in the following graph.
The three other main reasons, selected much less frequently, include a lack of time or resources, a lack of knowledge about where to find accessibility features, and the expense of incorporating these features.
Data sources and notes
Sources:
Statistics Canada. Table 33-10-1083-01. Forms of communication used, accessibility features provided and plans to provide accessibility features on forms of communication used by businesses and organization, fourth quarter of 2025, https://www150.statcan.gc.ca/t1/tbl1/en/cv!recreate.action?pid=3310108301&selectedNodeIds=2D1,2D15,3D2,3D8,3D14,3D20&checkedLevels=0D1,2D1&refPeriods=20250101,20250101&dimensionLayouts=layout2,layout2,layout3,layout2&vectorDisplay=false
Statistics Canada. Table 33-10-1084-01. Reasons accessibility features were not incorporated on any forms of communication over the last 12 months, fourth quarter of 2025, https://www150.statcan.gc.ca/t1/tbl1/en/cv!recreate.action?pid=3310108401&selectedNodeIds=2D1,2D15&checkedLevels=0D1,2D1&refPeriods=20250101,20250101&dimensionLayouts=layout2,layout2,layout3,layout2&vectorDisplay=false
“Arts, heritage, and entertainment” (which Statistics Canada refers to as “arts, entertainment, and recreation”) includes performing arts, spectator sports, and related industries (industry code 711); heritage institutions (code 712); amusement, gambling, and recreation industries (code 713). Breakdowns of the broad grouping are not possible in this dataset. “Information and cultural industries”, including many for-profit cultural industries, is a separate grouping that I have not analyzed here.