Changes in the economic impacts of the visual arts since 2010
Longer-term and pandemic-induced changes in Canada
Last week, I showed that the direct economic impact of the visual arts was $4 billion in Canada in 2021. I provided the breakdown for four areas of the visual arts and offered comparisons with the performing arts.
Today, I’ll look at changes in economic indicators for the visual arts before and during the pandemic, back to the beginning of comparable data in 2010.
Between 2019 and 2020, the GDP impact of Canada’s cultural sector decreased by 8% (after adjusting for inflation and population growth). Cultural jobs decreased by 11%. How did the visual arts fare? Have the visual arts recovered from their pandemic economic lows?
Two measures of the economic impact of the visual arts are provided:
Gross Domestic Product (GDP, or direct economic impact, a measure of net value-added to the economy). Changes in the GDP statistics have been adjusted for inflation and population growth to provide an estimate of real per capita growth or decline.
Jobs (including both full-time and part-time positions, not on a full-time-equivalent basis)
The changes in the financial statistics in this post have been adjusted for both inflation and population growth, which are also called real per capita changes. The quarterly changes have been adjusted for inflation only, not population growth in 2020 and 2021 (roughly 1% each year or about 0.25% each quarter).
Four areas of the visual arts are the focus of today’s post: original visual art, art reproductions, photography, and crafts.
Statistics Canada’s descriptions of the four areas of the visual arts are:
“Original visual art: includes original art such as paintings, drawings, pastels, engravings, prints, lithographs, sculptures and statuary, as well as dissemination services such as commercial art galleries.
Art reproductions: include copies of original visual arts, produced with the use of technology, such as unlimited edition prints, posters, statuettes, and ornaments.
Photography: includes traditional still and digital photography services, covering all fields including portrait, wedding, action, and specialty, commercial and industrial services.
Crafts: includes hand-made artisanal goods from all materials, including textiles, jewellery, pottery, statues, ceramics, furniture, housewares, musical instruments, etc.”
See the notes at the end of this post for further explanations and definitions.
Pandemic analysis
The visual arts, like many other sectors, were hard hit by the pandemic. The financial hit was substantial, with a more significant drop in 2020 than the average for the overall cultural sector.
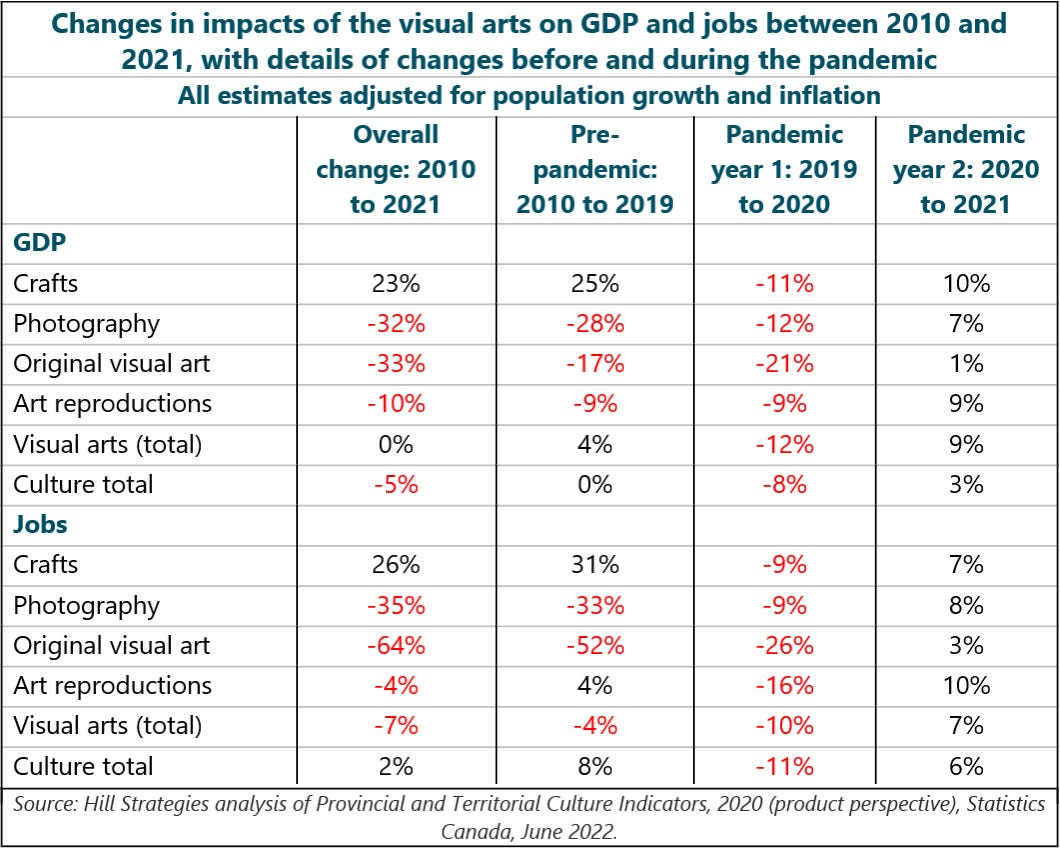
In 2020, GDP of the visual arts decreased by 12%, before rebounding by 9% in 2021 (both figures adjusted for inflation and population growth). Visual arts jobs decreased by 10% in 2020 and increased by 7% in 2021.
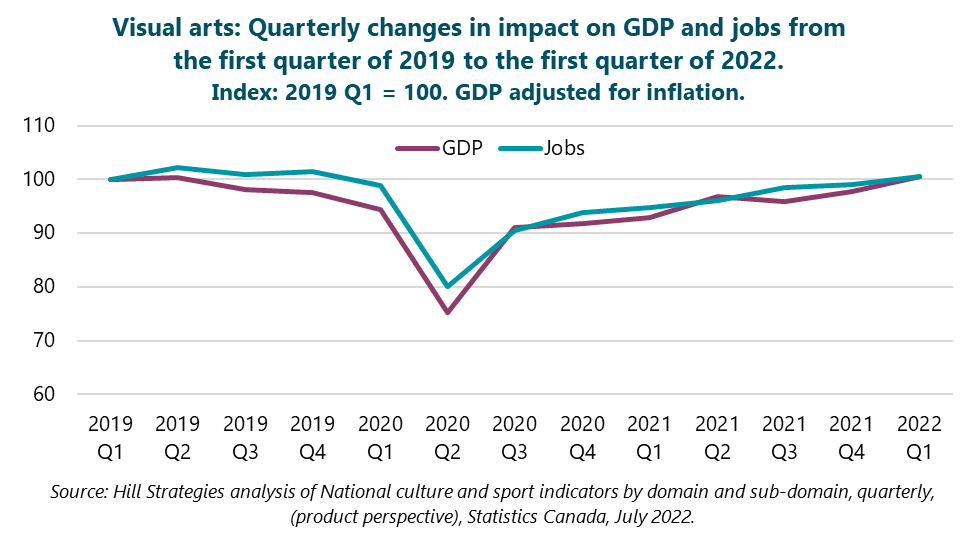
On a quarterly basis, the visual arts had their lowest economic impact in the second quarter of 2020. At that point, early in the pandemic, GDP was 25% lower than in early 2019, and visual arts jobs were 20% below the level of early 2019. (The quarterly figures have been adjusted for inflation but not population growth.)
Only in the first quarter of 2022 did the visual arts GDP and jobs rebound to their levels in early 2019, as shown in the following chart.
Longer-term changes: Pre-pandemic economic growth in the visual arts erased by the pandemic
Between 2010 and 2021, the overall cultural sector saw a 5% decrease in impact on GDP after adjusting for inflation and population growth. (Before the adjustments, the increase was 29%.) The GDP decrease came during the pandemic: there was essentially no change between 2010 and 2019 (-0.1%), but there was an 8% drop in 2020 and a 3% increase in 2021 (all statistics adjusted for inflation and population growth).
During the same timeframe, the visual arts saw no change in impact on GDP after adjusting for inflation and population growth. (Before the adjustments, the increase was 37%.) A 4% real per capita increase between 2010 and 2019 was followed by a 12% decrease in 2020 and a 9% rebound in 2021.
Culture sector jobs saw a 2% decrease between 2010 and 2021. As was the case with GDP, a large reduction in jobs occurred in 2020 (-11%), which negated an 8% increase between 2010 and 2019. There was a 6% rebound in cultural jobs in 2021.
Visual arts jobs decreased by 7% between 2010 and 2021. There was a 4% loss of visual arts jobs between 2010 and 2019, followed by a 10% decline in 2020 and a 7% rebound in 2021. (Visual arts jobs peaked at 50,600 in 2013 and decreased to 45,100 in 2021, the most recent year available.)
The following table highlights the key statistics for each area of the visual arts, with overall totals included for comparative purposes.
Notes and data sources
Statistics Canada defines culture sector GDP as:
The economic value added associated with culture activities. This is the value added related to the production of culture goods and services across the economy, regardless of the producing industry. Culture jobs are the number of jobs that are related to the production of culture goods and services.
The data capture direct impacts only and are therefore relatively modest. Excluded are commonly measured elements such as indirect impacts (the re-spending of the expenditures of cultural organizations) and induced impacts (the re-spending of wages earned by cultural workers and suppliers’ workers). Despite the smaller numbers, there are benefits to the narrower approach: the estimates are comparable between jurisdictions and to the GDP of other sectors of the economy.
This post analyzes Statistics Canada’s estimates of the impacts of culture products, i.e., the production of culture goods and services from establishments in both culture and non-culture industries. I’ve analyzed two Statistics Canada sources: Provincial and Territorial Culture Indicators, Table 36-10-0452-01 (yearly, from 2010 to 2020, newest release on June 2) and National culture and sport indicators by domain and sub-domain, Table 36-10-0652-01 (quarterly, from the first quarter of 2012 to the first quarter of 2022, Canada only, newest release on July 8).
Statistics Canada also provides another set of estimates, on culture industries, which captures the production of culture and non-culture goods and services from establishments within the culture industries. In 2020, the national culture products estimate ($56 billion, or $1,460 per capita) was 9% lower than the industries estimate ($61 billion, or $1,604 per capita).
For the real per capita calculations, population data were drawn from Population estimates on July 1st, by age and sex, Statistics Canada Table 17-10-0005-01. Inflation data were sourced from Consumer Price Index, annual average, not seasonally adjusted, Statistics Canada Table 18-10-0005-01.


