Nearly $40 billion in revenues for arts products (according to a minimum estimate)
Analysis of jobs, revenues, and direct impact on GDP related to arts products
Today’s article delves into economic indicators in 2024 for my best approximation of “the arts” from a national dataset. I also highlight economic changes between 2012 and 2024. This follows my article last week on the overall cultural sector.
The measurement of arts products in this article is imperfect and partial – a measurement of convenience rather than one that was specifically designed to capture all facets of the arts. It’s my combination, not one created by Statistics Canada.
Here are Statistics Canada’s categories (called “domains” and “subdomains”) that fit well into my approximation of arts products:
Live performance products, which include performing arts as well as cultural festivals and celebrations
Specific visual arts products, including crafts, photography, original visual art, and art reproductions (but not the separate subdomains for architecture, advertising, and design)
Books (but not subdomains for newspapers, periodicals, and other published works)
Film & video products (but not subdomains for broadcasting and interactive media)
Sound recording and music publishing products
Two important elements that are excluded from the estimates of arts products are broad categories that span the entire arts, culture, and heritage sector:
All government-owned arts venues, funding, and support organizations, which are included in the very broad category of “governance, funding, and professional support” (a category that cannot be broken down into the different product areas)
Education and training (again, that cannot be broken down into the different product areas)
Because of these exclusions, today’s statistics should be considered a minimum measurement of the revenues, GDP impact, and jobs related to arts products. For context, the areas covered in today’s article represent close to one-third of overall revenues in the arts, culture, and heritage. This percentage is lower than it would be with a more complete measurement of the arts.
The five areas covered today (as a group) will be unpacked in future articles related to performing arts, visual arts, film and video, books, and sound recording.
As was the case last week, the analysis includes three key economic indicators:
Output (aka total revenues)
Direct impact on Gross Domestic Product (GDP)
Jobs
The estimates relate to arts products, i.e., the production of artistic goods and services from cultural organizations and industries as well as non-cultural organizations and industries.
To add depth and context, I analyze the historical estimates of revenues and GDP in three ways: 1) as published by Statistics Canada (“nominal” statistics); 2) adjusted for inflation (“real changes”); and 3) adjusted for both inflation and population growth (“real per capita changes”).
The analysis is based on Canada-wide statistics from Statistics Canada’s National Culture Indicators for 2024. In the 2024 dataset, many indicators have seen notable revisions for 2021 through 2023, including film and video, performing arts, crafts, and books. Because of these revisions, my analysis today is not directly comparable to my similar analysis last year.
Details about the data sources and other notes are provided at the end of this article.
$38 billion in revenues for arts products in 2024
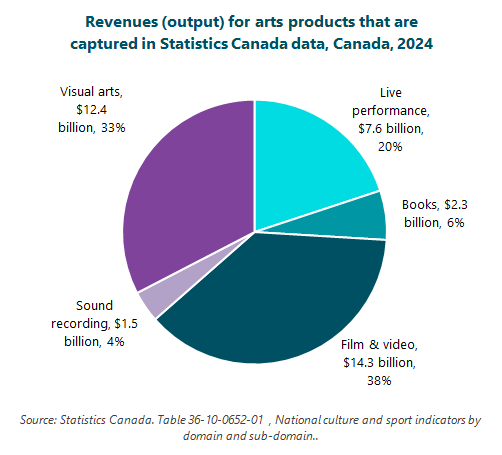
Total revenues in the arts, using my imperfect and partial measurement, were $37.9 billion in 2024, representing 29% of all cultural products (which were analyzed in last week’s article).
Revenues by type of arts products
Today’s first graph provides a breakdown of total revenues (aka output) for arts products that are captured and well defined in Statistics Canada’s data. Film and video products account for the largest share of revenues for arts products in 2024: $14.3 billion, or 38%. Next are the broader visual arts, including crafts and photography, with $12.4 billion in revenues (33%) and live performances ($7.6 billion, or 20%). The final two areas represent much smaller shares of total revenues for my imperfect and partial estimate of the arts: books ($2.3 billion, or 6%) and sound recording ($1.5 billion, or 4%).
A detailed analysis of each of these arts products will be provided in subsequent articles.


