Arts and culture workers in 2021
Occupation-based statistics from the Canadian Labour Force Survey
In this post, I highlight some important facts about arts and culture workers in Canada, based largely on data that I commissioned from Statistics Canada’s Labour Force Survey (LFS).
Key stats in this post: # of arts and culture workers. Hours worked. % of all Canadian workers. Self-employment rate for arts and culture workers, compared with the overall labour force.
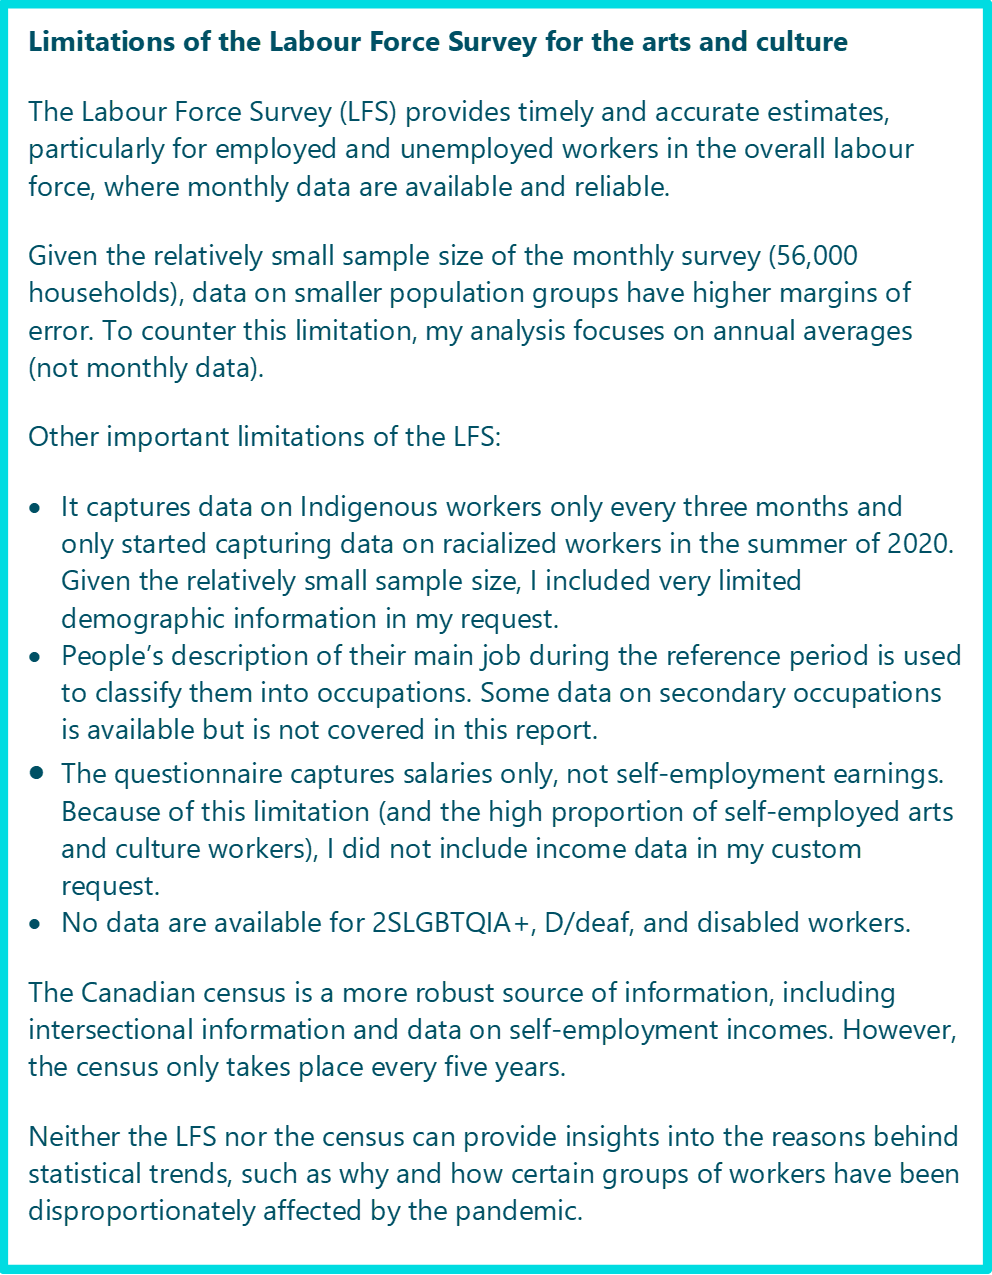
I expect to have at least a few posts from this LFS data, so I’ll start with quite a few notes for you to keep in mind, especially when thinking about the pandemic-related statistics in tomorrow’s post. For other limitations, see the box at the end of this post on Limitations of the Labour Force Survey.
This LFS data request was a bit of a test case for me, and I only ordered Canada-wide data. If you’re interested in similar provincial data, please let me know in the comments section. (I don’t believe that municipal data from the LFS would be particularly reliable, except *maybe* for the largest cities.)
One major caveat before digging into what “arts and culture workers” means: I didn’t request data on the earnings of arts and culture workers, because the LFS questionnaire captures salaries only, not self-employment earnings.
Key findings in 2021
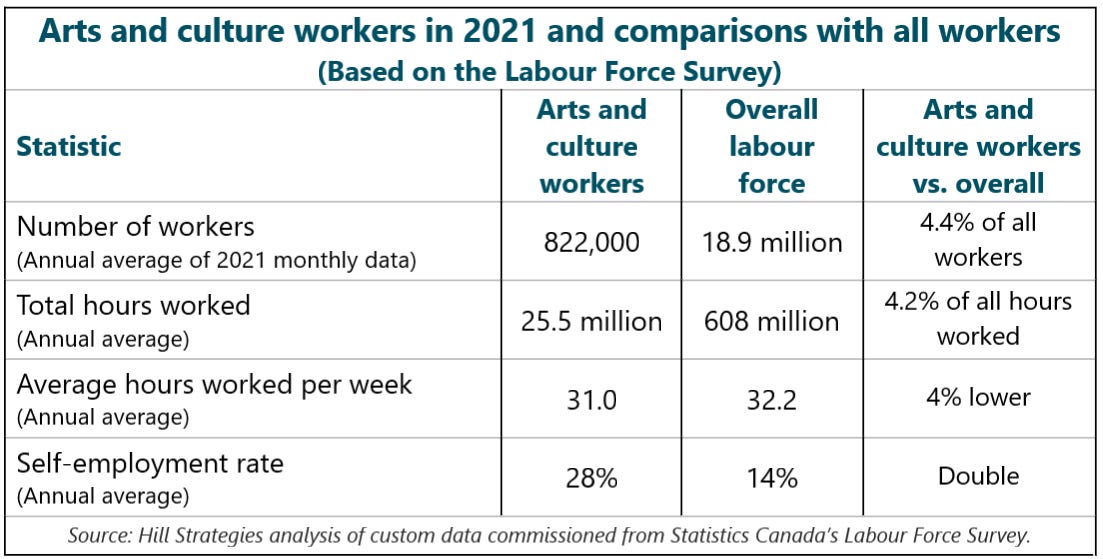
822,000 arts and culture workers in Canada
4.4% of all workers in the country
25.5 million hours worked by arts and culture workers
4.2% of hours worked by all Canadian workers
72% of arts and culture workers are employed, and the other 28% are self-employed
Self-employment rate is twice as high as the overall labour force
Broad definition of “arts and culture workers”
One key thing to understand: the definition of “arts and culture workers” here is broad. It follows Statistics Canada’s definition of the culture sector labour force and is in keeping with Hill Strategies’ previous work on cultural workers.
50 occupation groups are included as “arts and culture workers”. This includes heritage occupations (e.g., librarians, museum workers, archivists), cultural occupations (e.g., designers, editors, architects), and artists (e.g., musicians, visual artists, writers, actors, dancers) (See this pdf file for a list of all 50 occupation groups.)
This broad occupational view complements the excellent tracking work by Frédéric Julien of CAPACOA. His work during the pandemic has focused on arts and culture industries, and the performing arts in particular. (See, for example, Employment among arts and entertainment industries falls back to square one.)
In the broad occupational view in this post, arts and culture workers are not strongly concentrated in arts and culture industries. Rather, they work in a wide range of industries. Based on the detailed data available in the 2016 census, the most common industry groups for these workers are:
Professional services: 24% of arts and culture workers, including many architects, photographers, designers, and other creative professionals (industry code 54)
Information and cultural industries: 19% of arts and culture workers, including librarians and other library workers, film and TV managers and technicians, journalists, as well as producers and directors (industry code 51).
Arts, entertainment, and recreation: 12% of arts and culture workers, including many artists as well as managers, curators, and technicians in museums and art galleries (industry code 71)
Manufacturing: 9% of arts and culture workers, including printing press operators and other publishing workers, textile patternmakers, many industrial designers, as well as quite a few artisans and craftspeople (industry codes 31-33)
The LFS information is available only for the 50 occupations as a group, not for subsets or individual occupations.
Employment situation of arts and culture workers in 2021
In 2021, there were 822,000 arts and culture workers in Canada, representing 4.4% of all workers in the country. (The 2021 census, with its larger sample size, will provide a more “definitive” estimate of arts and culture workers, but this one should be useful in the meantime and for historical comparisons within the LFS dataset.)
Collectively, arts and culture workers logged 25.5 million hours of work in 2021, or 4.2% of the total for all Canadian workers.
72% of arts and culture workers are employed (590,000), and the other 28% are self-employed (232,000). The self-employment rate among arts and culture workers (28%) is double that in the overall labour force (14% in 2021).
In 2021, the self-employment rate among arts and culture workers (28%) was the lowest such rate since 1997, the first year of the data request.
Artists represent 18% of all arts and culture workers. Employed artists represent only 9% of employed arts and culture workers, but self-employed artists represent 43% of self-employed arts and culture workers. (A previous report provided an in-depth analysis of the situation of artists, especially self-employed ones.)
Quick glimpse at monthly data
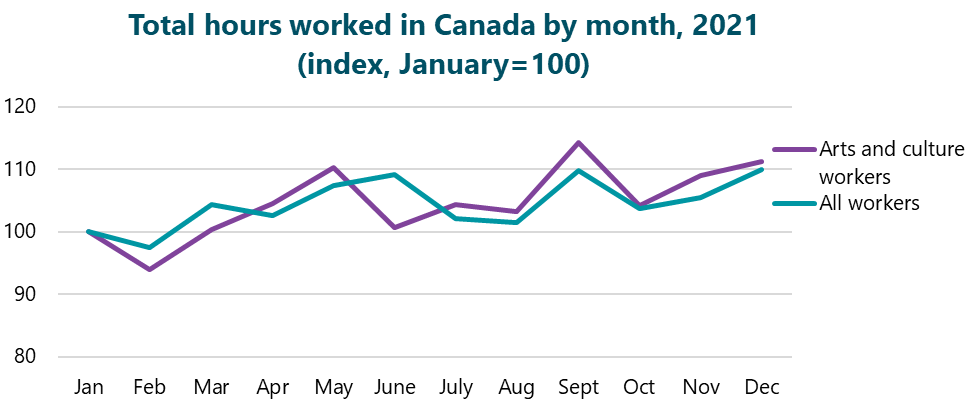
Arts and culture workers had the fewest hours worked in January, February, and March of 2021. The highest levels came in May, September, November, and December. There was a bit of a lull in the summer months (June through August). In general, this is similar to the situation for all Canadian workers.
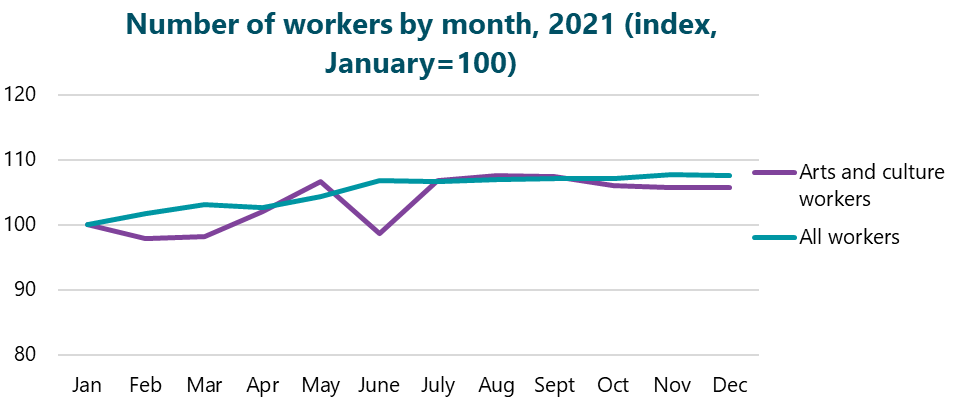
The number of arts and culture workers increased between January and May of 2021 and stayed near that level for the rest of the year, with the exception of a one-month decrease in June. (This could be just a data error.) Again, this trend was similar to the situation of all Canadian workers.
In the works…
Tomorrow, I’ll look at pandemic-related changes for arts and culture workers, followed by two more LFS posts next week: 1) longer term trends back to 1997; and 2) differences between women and men arts and culture workers.


