All signs point to precarity
Income volatility and low income of artists and content creators are confirmed by a new-ish survey
Just over a week ago, the Department of Canadian Heritage released the results of a survey of over 4,700 artists and content creators that was conducted between May and July of 2021. The report’s interesting but not particularly surprising key findings were:
Respondents’ creative incomes are volatile and low
Many respondents still rely on traditional income sources
A majority of respondents are self-employed
The pandemic hit some fields particularly hard
Key survey findings point to a high degree of precarity among artists and content creators. Low income. Income volatility. Self-employment. Even worse during the pandemic.
In case you missed it, I also wrote about precarity in the arts in a post in the fall of 2021.
Today, I’m going to focus mainly on the survey’s measures of pre-pandemic creative income and income volatility, as these have not been commonly quantified in Canada. First, though, I’ll run through some key elements of the survey’s methods and present an overview of respondents’ income statistics.
Methods
Because the survey did not involve random participation, a margin of error cannot be calculated for the results. That being said, 4,747 people is a very large sample size. (The Department’s goal was 1,000.)
Who are “artists and content creators”? The survey asked respondents to choose one of the following types of creative work:
Visual artist (27% of all respondents)
Performing artist (25%)
Musical artist (18%)
Writer (17%)
Audiovisual director / content creator (13%)
A reasonable proportion of respondents self-identified as a member of one or more of the equity-seeking groups that were listed in the survey, including women, people with low income, LGBTQ2S+ communities, racialized communities, Deaf communities and persons with disabilities, seniors, rural communities, immigrants and refugees, official language minority communities, ethno-cultural communities, gender diverse communities, youth, religious minorities, Indigenous Peoples, as well as remote and northern communities. Only 13% selected “none of the above”. Unfortunately, the data tables offer only a few details of the situation of these equity-seeking artists and content creators.
For this post, I dug into the report’s data tables to see what they say about the precarity of different groups of artists and content creators.
Income levels are low for many artists and content creators, with a majority earning less than $40,000 from all sources.
There is huge volatility in creative income (even before the pandemic), with more than one-half of respondents seeing fluctuations in creative income of more than one-half from year to year.
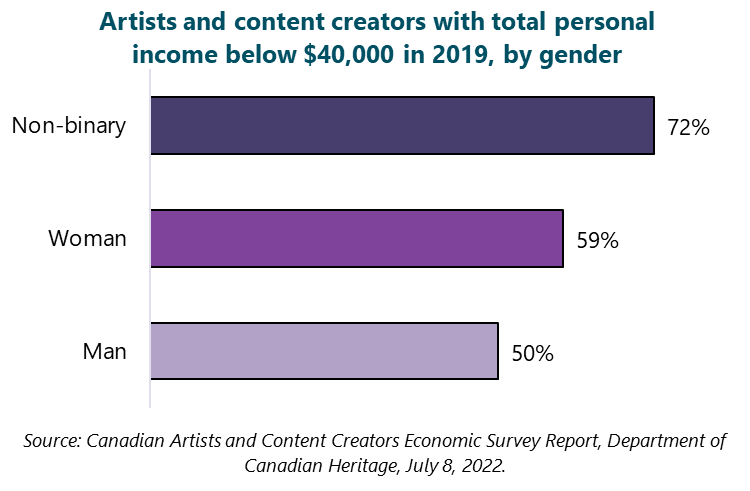
Total personal income is lower for non-binary and women artists and content creators than men. Total personal income is particularly low for visual and performing artists.
Creative income tends to represent a lower proportion of total income for writers and visual artists than for other types of artists and content creators.
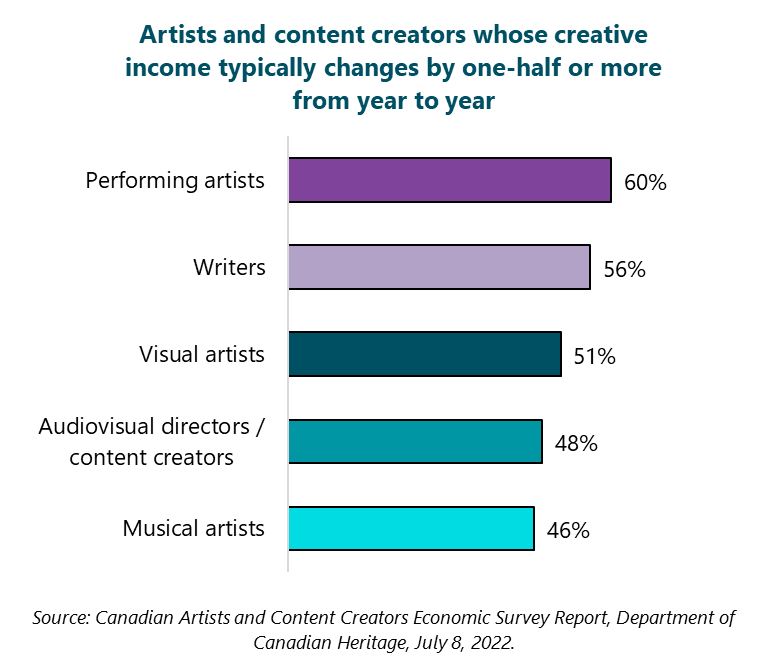
Performing artists and writers are most likely to have significant year-to-year fluctuations in their creative income.
Low income levels for many artists and content creators
Most respondents (56%) earned less than $40,000 in 2019 (before the pandemic), from all sources, not just their creative work. This includes the 13% of respondents who earned less than $10,000 from all sources, the 15% who earned between $10,000 and $19,999, and the 28% who earned between $20,000 and $39,999.
Total personal income is lowest among non-binary and women artists and content creators, as highlighted in this graph.
Among the five types of artists and content creators included in the survey, total personal income is particularly low for visual and performing artists.
Unfortunately, the survey’s data tables did not provide similar cross-tabulations for equity-seeking groups.
Survey question
“What was your total gross (pre-tax) personal annual income in 2019?”
Under $9,999 / $10,000 to $19,999 / $20,000 to $39,999 / $40,000 to $59,999 / $60,000 to $79,999 / $80,000 to $99,999 / $100,000 to $124,999 / $125,000 to $149,000 / $150,000 to $199,999 / $200,000 and over / Prefer not to say
Huge volatility in creative income
More than half earn less than half of their total income from creative work
Over one-half of respondents (56%) indicated that their creative income (e.g., “sales, performance, wages, commissions, royalties, etc.”) represents less than one-half of their overall personal income. Within this larger grouping, many artists and creators indicated that they earn no creative income (14%) or less than one-quarter of their overall income (31%). At the opposite end of the scale, about one-quarter of respondents (23%) indicated that their creative income accounts for all their personal income.
The following graph shows that writers and visual artists are most likely to have creative income representing less than one-half of their total personal income. Roughly two-thirds or more of writers and visual artists are in this situation.
Survey question
“Pre-pandemic, in 2019 what proportion of your personal income came from activities related to your creative work? (Sales, performance, wages, commissions, royalties, etc.)“
None / Less than 25% / 25% to 49% / 50% to 74% / 75% to 99% / 100%
More than half see fluctuations in creative income of more than half
Just over one-half of respondents (53%) indicated that their creative income typically fluctuates by at least one-half from year to year (before the pandemic). This includes exactly one-quarter of respondents who indicated that their creative income typically varies by at least 100% from year to year.
As shown in the graph below, performing artists and writers are most likely to have significant year-to-year fluctuations in their creative income. In fact, shifts of 50% or more are the norm among these groups (as well as among visual artists).
Survey question
“Please select the option that best describes how much your income levels from your work as a [type of artist] typically change, year to year (without taking the pandemic into consideration).“
It can go up or down by at least 100% (double)
It can go up or down by at least 50% (half)
It can go up or down by at least 25% (quarter)
It can go up or down by at least 10% (tenth)
It stays about the same


